
Basic Information
Description
The recombinant-activating gene 2 (Rag2) plays an important role in the rearrangement and recombination of the genes of immunoglobulin and T cell receptor molecules during the initiation of V(D)J recombination. Loss of Rag2 protein leads to no mature T and B cells, the critical components of the adaptive immune system. This rat can be used to support research in many areas including immune system defections, virology research and cancer research etc.
-
B-Rag2 KO rats exhibit the smallest thymus size

-
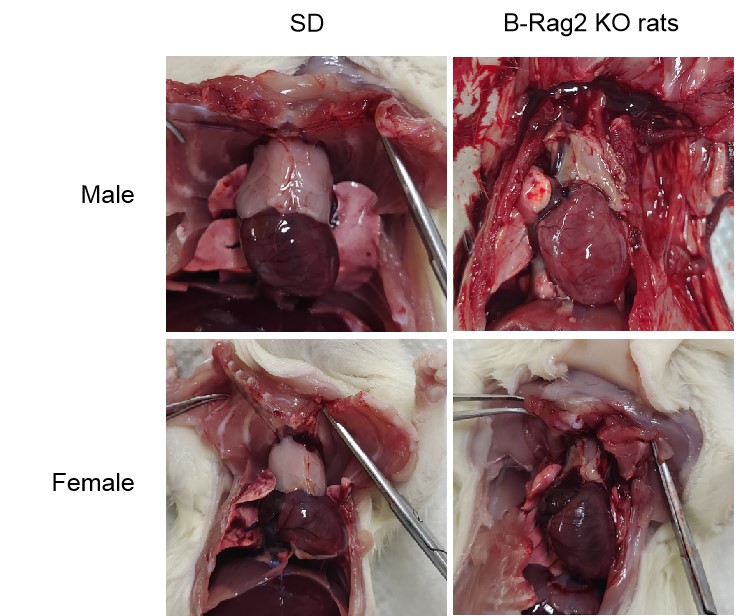
The thymus sizes of B-Rag2 KO rats were reduced compared to that of wild-type SD rats. Gross anatomy of thymuses in male and female wild-type SD rats and B-Rag2 KO rats were showed (n=3, 7-week-old). Thymus sizes of B-Rag2 KO rats were significantly reduced compared to that of wild-type SD rats.
-
B-Rag2 KO rats exhibit the significantly reduced thymus and spleen weight
-
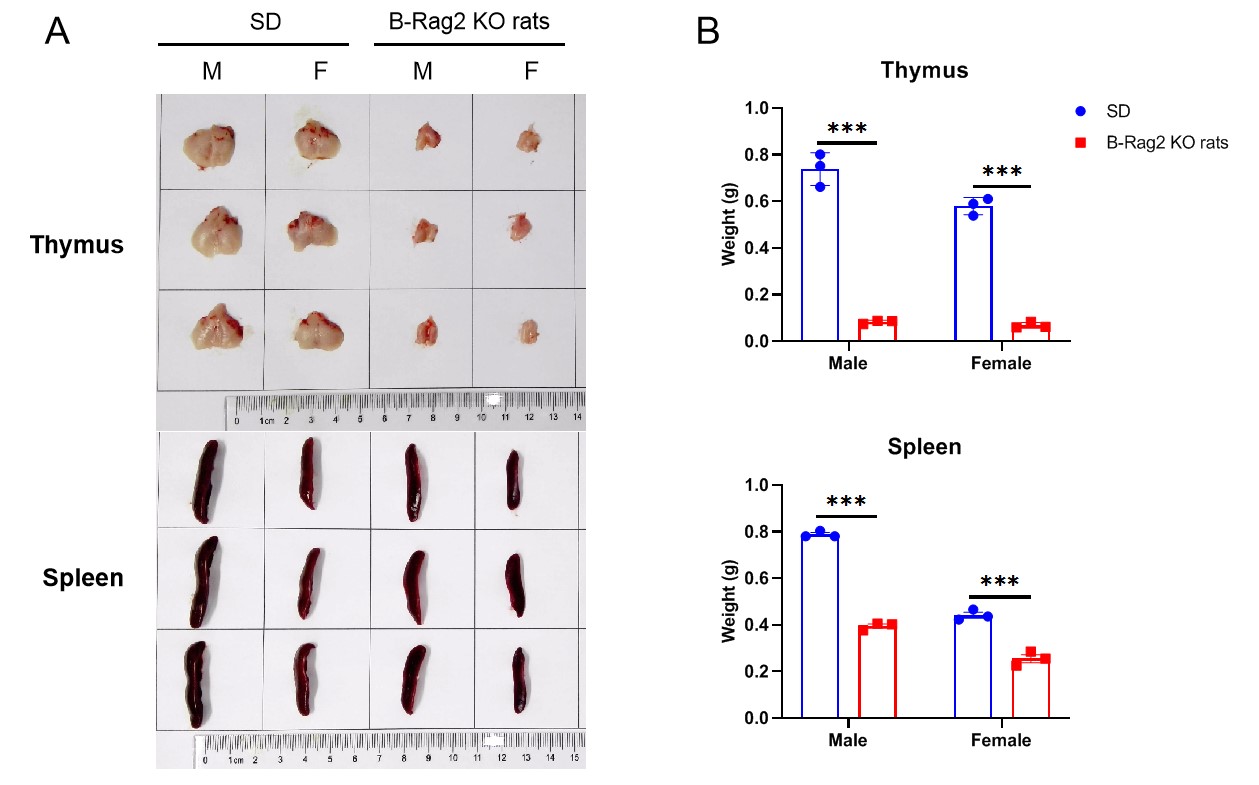
The size and weight of thymus and spleen of B-Rag2 KO rats were significantly reduced compared to that of wild-type SD rats. Thymus and spleen were isolated from male and female wild-type SD rats and B-Rag2 KO rats and weighed (n=3, 7-week-old). Thymus size and weight of B-Rag2 KO rats were significantly reduced compared to that of wild-type SD rats. Spleen size and weight of B-Rag2 KO rats were significantly reduced compared to that of wild-type SD rats.
-
Analysis of leukocyte subpopulation in thymus
-
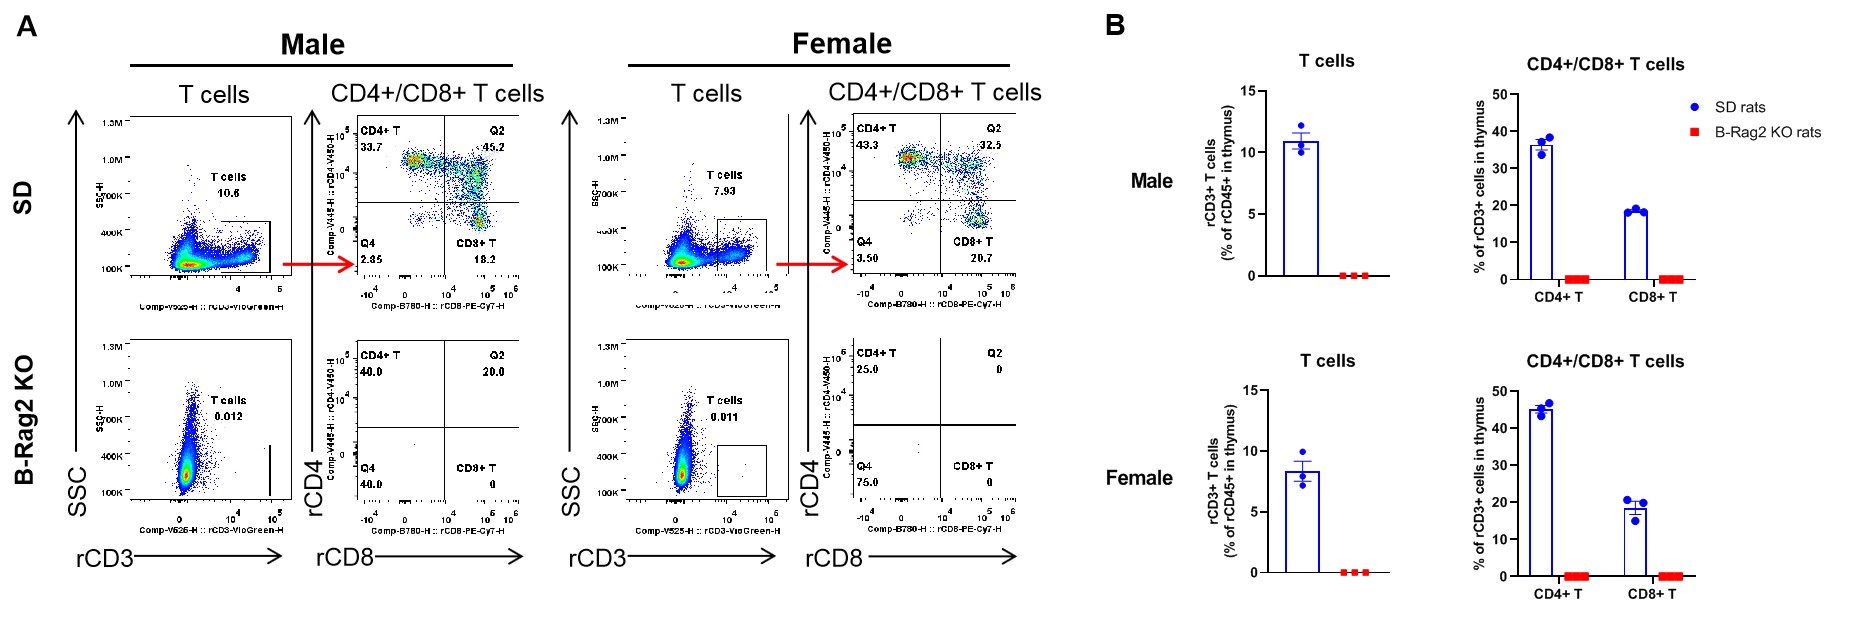
Complete loss of T cells in thymus of homozygous B-Rag2 KO rats. Thymuses were collected from male and female wild-type SD rats and B-Rag2 KO rats (n=3, 7-week-old). Leukocyte subpopulations were analyzed by flow cytometry analysis. A. Representative FACS plots. B. Statistical analysis of FACS. Results showed that total T cells, CD4+ T cells and CD8+ T cells were only detectable in thymuses of wild-type SD rats. But none of the T cells were detectable in thymuses of B-Rag2 KO rats. Values are expressed as mean ± SEM.
-
Analysis of leukocyte subpopulation in spleen of male rats
-
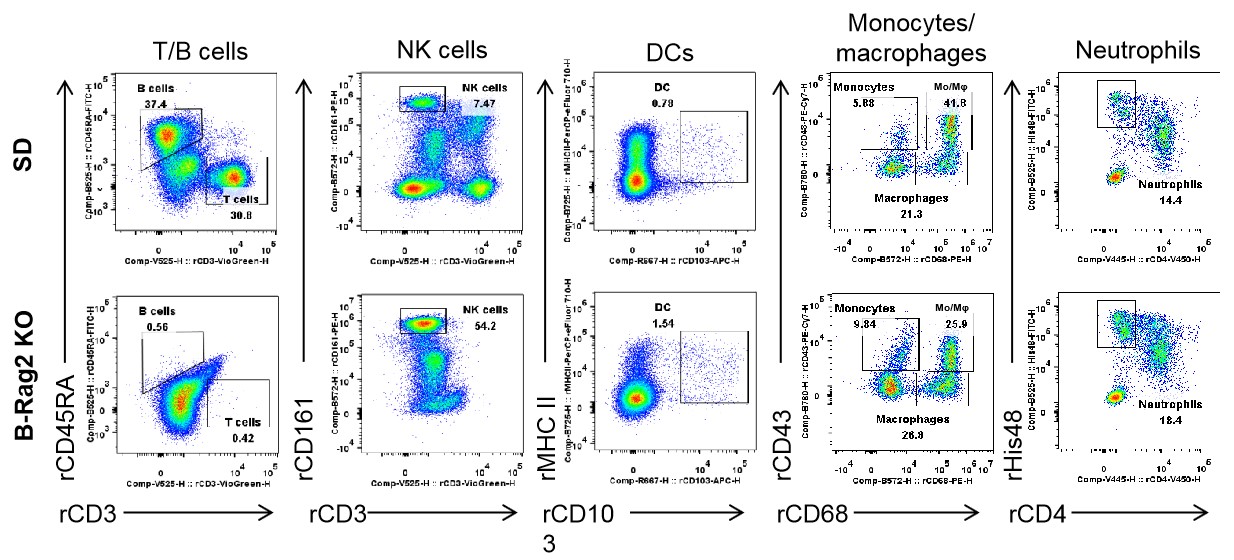
Complete loss of T cells and B cells in spleen of homozygous male B-Rag2 KO rats. Spleens were collected from male wild-type SD rats and B-Rag2 KO rats (n=3, 7-week-old). Leukocyte subpopulations were analyzed by flow cytometry analysis. Results showed that T cells and B cells were not detectable in spleen of B-Rag2 KO rats. The percentage of NK cells in B-Rag2 KO rats were relatively higher than that in wild-type SD rats. The percentages of DCs, CD11b+CD43+ monocytes, CD11b+CD68+ macrophages, CD11b+CD43+CD68+ monocytes/macrophages (Mo/Mφ) and neutrophils in B-Rag2 KO rats were relatively higher than that in wild-type SD rats. Values are expressed as mean ± SEM.
-
Analysis of leukocyte subpopulation in spleen of female rats
-
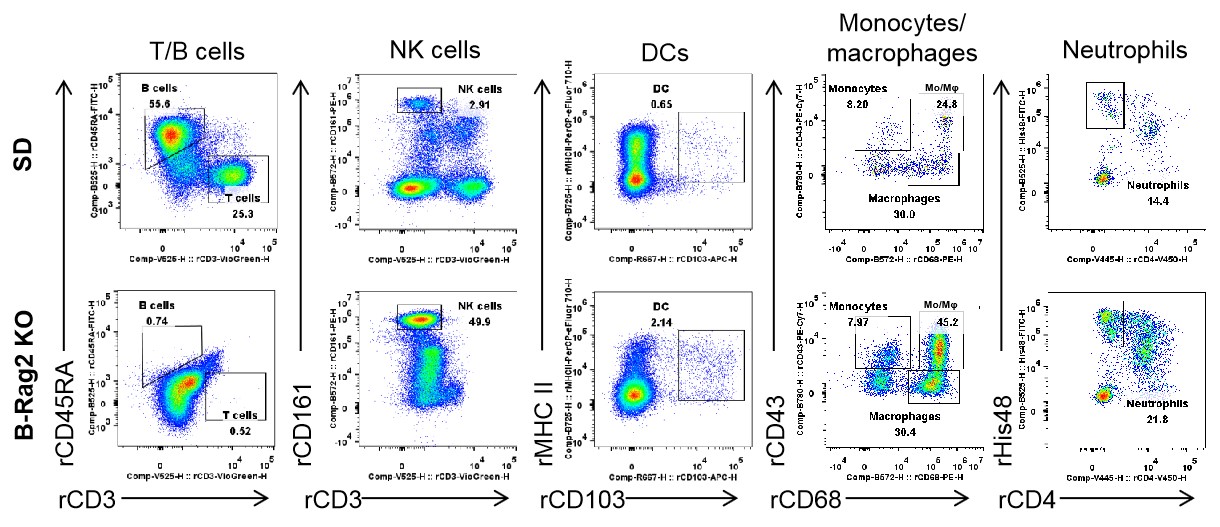
Complete loss of T cells and B cells in spleen of homozygous female B-Rag2 KO rats. Spleens were collected from female wild-type SD rats and B-Rag2 KO rats (n=3, 7-week-old). Leukocyte subpopulations were analyzed by flow cytometry analysis. Results showed that T cells and B cells were not detectable in spleen of B-Rag2 KO rats. The percentage of NK cells in B-Rag2 KO rats were relatively higher than that in wild-type SD rats. The percentages of DCs, CD11b+CD43+ monocytes, CD11b+CD68+ macrophages, CD11b+CD43+CD68+ monocytes/macrophages (Mo/Mφ) and neutrophils in B-Rag2 KO rats were relatively higher than that in wild-type SD rats. Values are expressed as mean ± SEM.
-
Analysis of leukocyte subpopulation in spleen
-
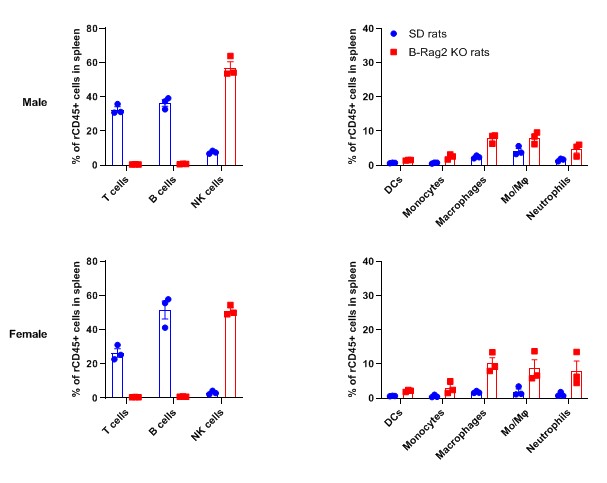
Complete loss of T cells and B cells in spleen of homozygous male and female B-Rag2 KO rats. Spleens were collected from male and female wild-type SD rats and B-Rag2 KO rats (n=3, 7-week-old). Leukocyte subpopulations were analyzed by flow cytometry analysis. Results showed that T cells and B cells were not detectable in spleen of B-Rag2 KO rats. The percentage of NK cells in B-Rag2 KO rats were relatively higher than that in wild-type SD rats. The percentages of DCs, CD11b+CD43+ monocytes, CD11b+CD68+ macrophages, CD11b+CD43+CD68+ monocytes/macrophages (Mo/Mφ) and neutrophils in B-Rag2 KO rats were relatively higher than that in wild-type SD rats. Values are expressed as mean ± SEM.
-
Analysis of leukocyte subpopulation in blood of male rats
-
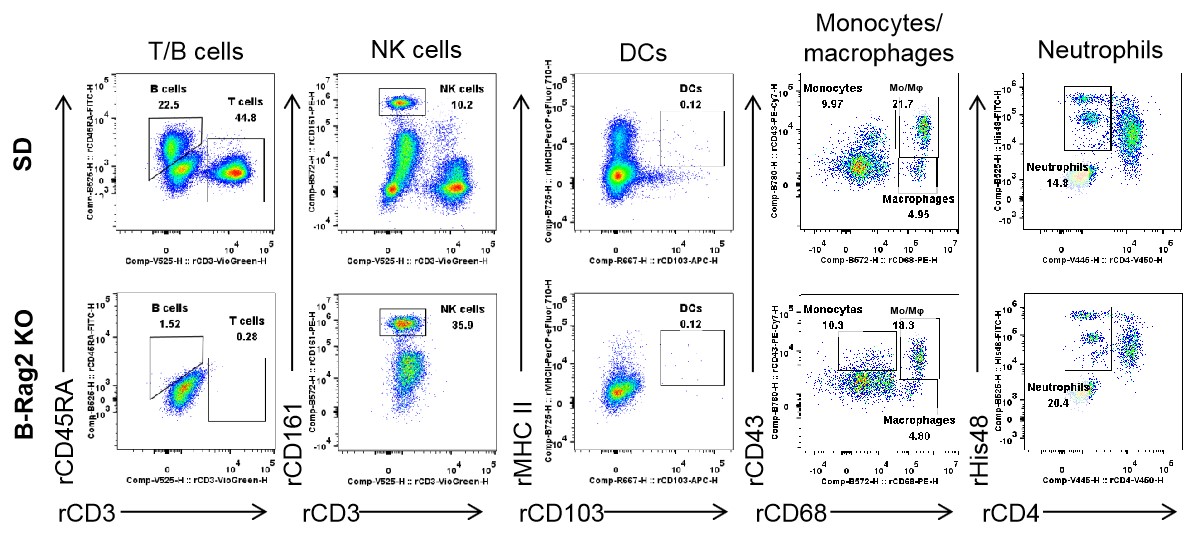
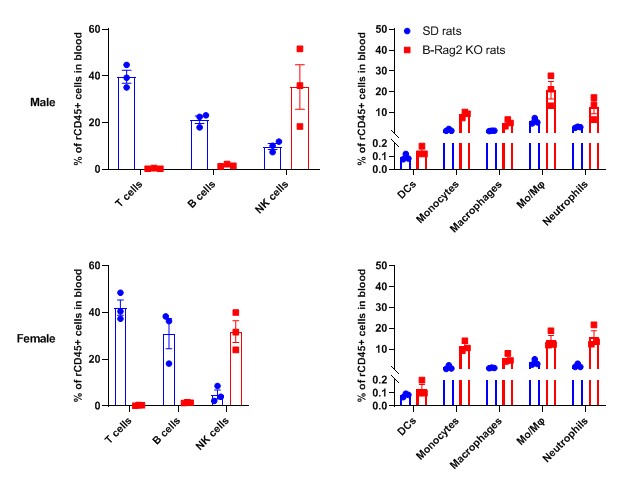
Complete loss of T cells and B cells in blood of homozygous male B-Rag2 KO rats. Blood cells were collected from male wild-type SD rats and B-Rag2 KO rats (n=3, 7-week-old). Leukocyte subpopulations were analyzed by flow cytometry analysis. Results showed that T cells and B cells were not detectable in blood of B-Rag2 KO rats. The percentage of NK cells in B-Rag2 KO rats were relatively higher than that in wild-type SD rats. The percentages of DCs, CD11b+CD43+ monocytes, CD11b+CD68+ macrophages, CD11b+CD43+CD68+ monocytes/macrophages (Mo/Mφ) and neutrophils in B-Rag2 KO rats were relatively higher than that in wild-type SD rats. Values are expressed as mean ± SEM.
-
Analysis of leukocyte subpopulation in blood of female rats
-
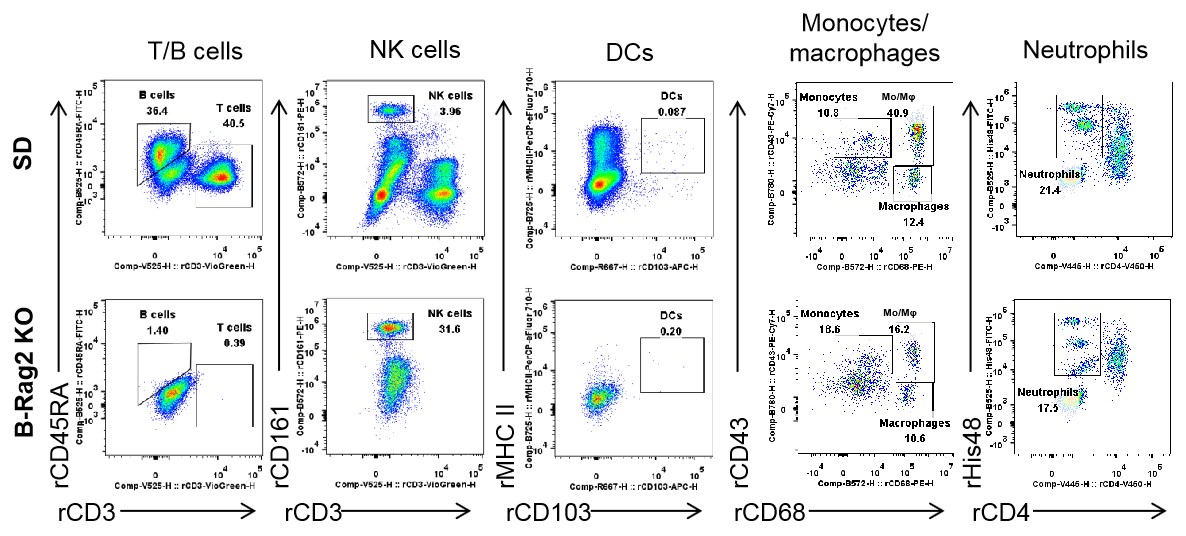
Complete loss of T cells and B cells in blood of homozygous female B-Rag2 KO rats. Blood cells were collected from female wild-type SD rats and B-Rag2 KO rats (n=3, 7-week-old). Leukocyte subpopulations were analyzed by flow cytometry analysis. Results showed that T cells and B cells were not detectable in blood of B-Rag2 KO rats. The percentage of NK cells in B-Rag2 KO rats were relatively higher than that in wild-type SD rats. The percentages of DCs, CD11b+CD43+ monocytes, CD11b+CD68+ macrophages, CD11b+CD43+CD68+ monocytes/macrophages (Mo/Mφ) and neutrophils in B-Rag2 KO rats were relatively higher than that in wild-type SD rats. Values are expressed as mean ± SEM.
-
Analysis of leukocyte subpopulation in blood
-
Complete loss of T cells and B cells in blood of homozygous male and female B-Rag2 KO rats. Blood cells were collected from male and female wild-type SD rats and B-Rag2 KO rats (n=3, 7-week-old). Leukocyte subpopulations were analyzed by flow cytometry analysis. Results showed that T cells and B cells were not detectable in blood of B-Rag2 KO rats. The percentage of NK cells in B-Rag2 KO rats were relatively higher than that in wild-type SD rats. The percentages of DCs, CD11b+CD43+ monocytes, CD11b+CD68+ macrophages, CD11b+CD43+CD68+ monocytes/macrophages (Mo/Mφ) and neutrophils in B-Rag2 KO rats were relatively higher than that in wild-type SD rats. Values are expressed as mean ± SEM.
-
THP-1 human leukemia xenograft model in B-Rag2 KO rats
-
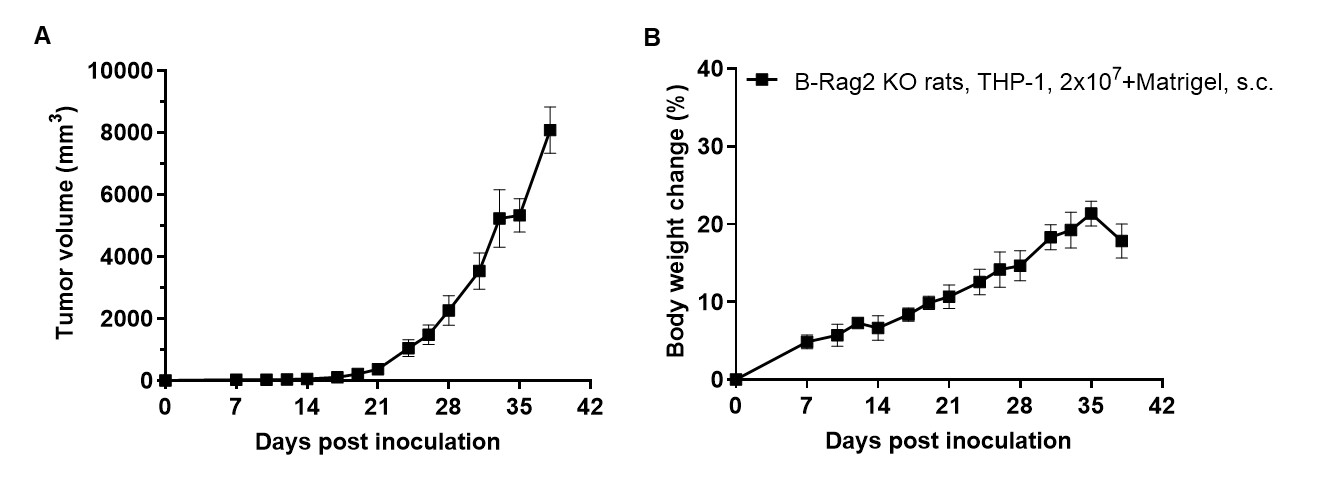
Subcutaneous homograft tumor growth of THP-1 cells in B-Rag2 KO rats. Human acute monocytic leukemia cell line THP-1 (2×10⁷) were mixed with Matrigel and inoculated subcutaneously into B-Rag2 KO rats (n=5). (A)Tumor volume. (B) Body weight change. As shown in panel A, THP-1 cells were able to establish tumors in B-Rag2 KO rats, indicating that B-Rag2 KO rats can be used for efficacy studies.
-
NCI-H2122 human lung cancer xenograft model in B-Rag2 KO rats
-
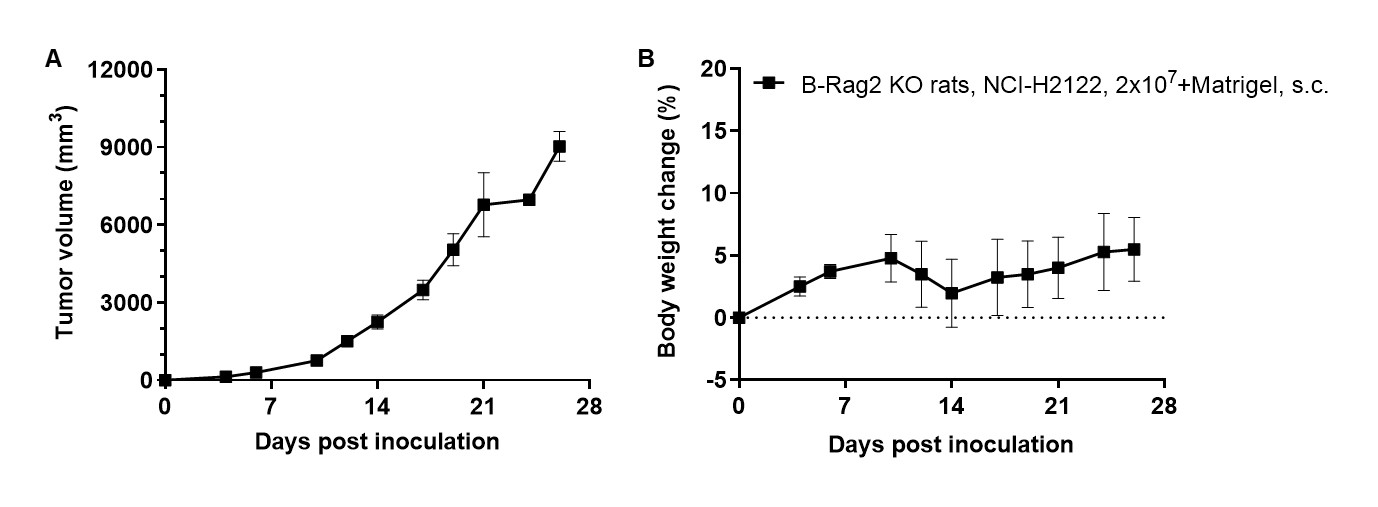
Subcutaneous homograft tumor growth of NCI-H2122 cells in B-Rag2 KO rats. Human non-small cell lung cancer cell line NCI-H2122 (2×10⁷) were mixed with Matrigel and inoculated subcutaneously into B-Rag2 KO rats (n=5). (A)Tumor volume. (B) Body weight change. As shown in panel A, NCI-H2122 cells were able to establish tumors in B-Rag2 KO rats, indicating that B-Rag2 KO rats can be used for efficacy studies.
-
H460 human lung cancer xenograft model in B-Rag2 KO rats
-
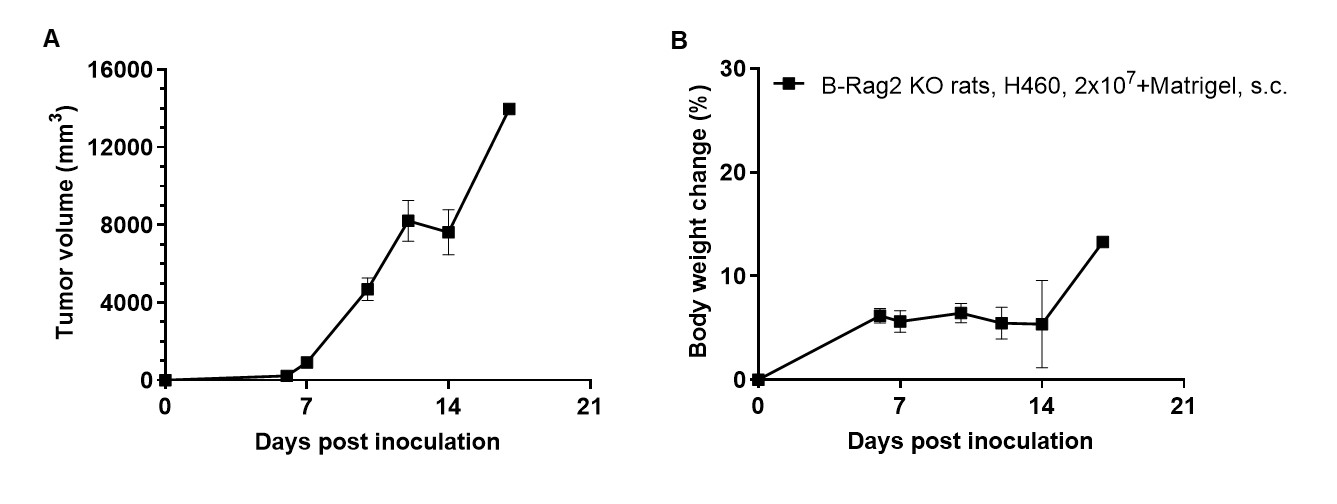
Subcutaneous homograft tumor growth of H460 cells in B-Rag2 KO rats. Human lung cancer cell line H460 (2×10⁷) were mixed with Matrigel and inoculated subcutaneously into B-Rag2 KO rats (n=5). (A)Tumor volume. (B) Body weight change. As shown in panel A, H460 cells were able to establish tumors in B-Rag2 KO rats, indicating that B-Rag2 KO rats can be used for efficacy studies.
-
NCI-H1373 human lung cancer xenograft model in B-Rag2 KO rats
-
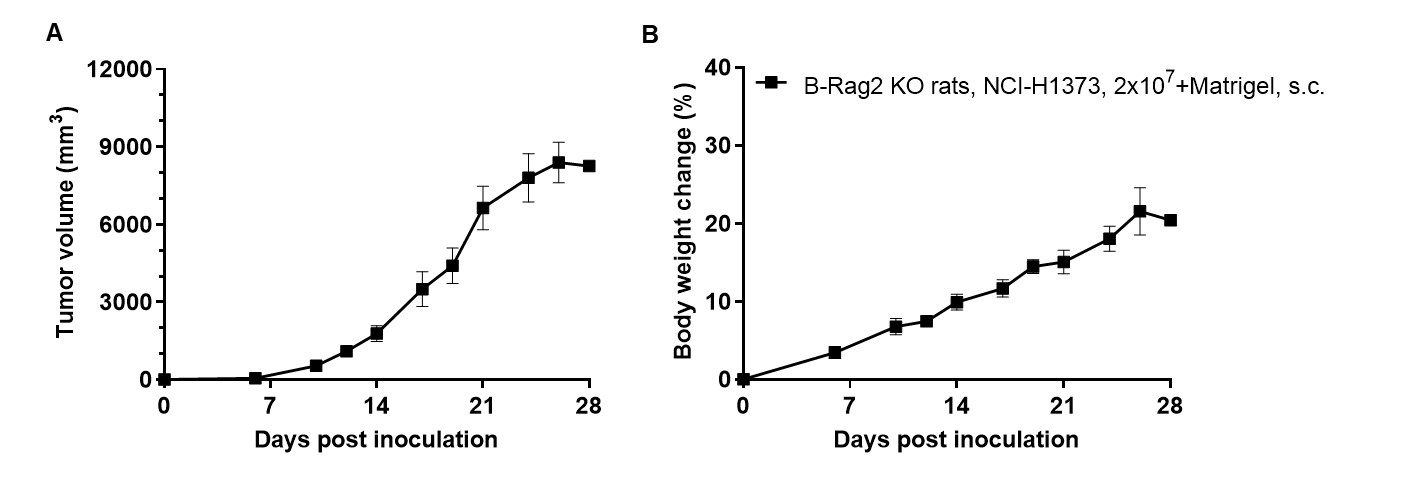
Subcutaneous homograft tumor growth of NCI-H1373 cells in B-Rag2 KO rats. Human lung cancer cell line NCI-H1373 (2×10⁷) were mixed with Matrigel and inoculated subcutaneously into B-Rag2 KO rats (n=5). (A)Tumor volume. (B) Body weight change. As shown in panel A, NCI-H1373 cells were able to establish tumors in B-Rag2 KO rats, indicating that B-Rag2 KO rats can be used for efficacy studies.
-
A549 human lung cancer xenograft model in B-Rag2 KO rats
-
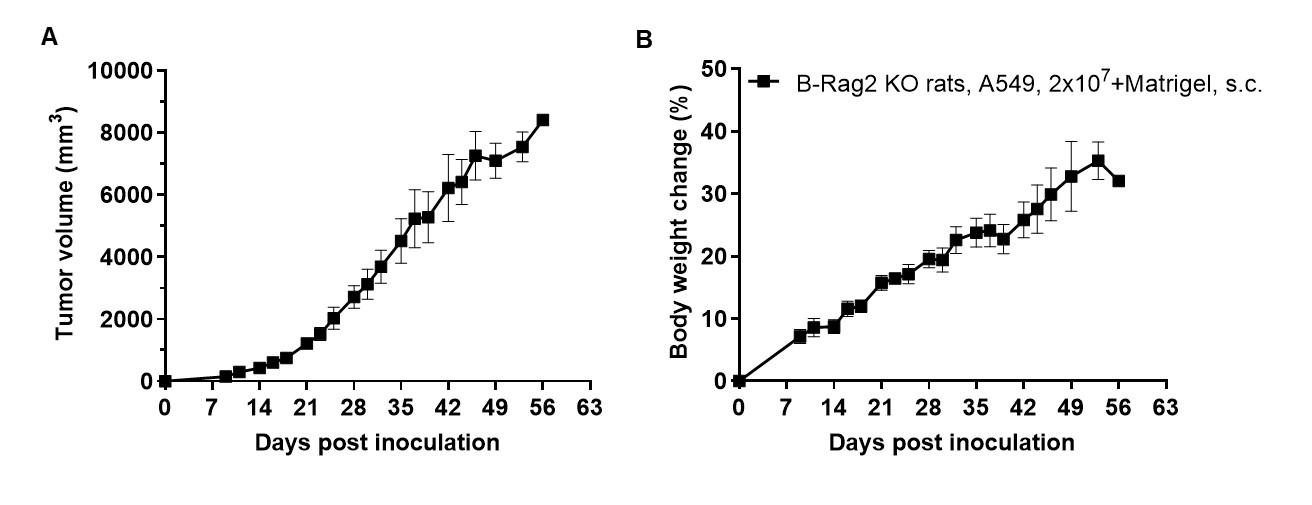
Subcutaneous homograft tumor growth of A549 cells in B-Rag2 KO rats. Human lung cancer cell line A549 (2×10⁷) were mixed with Matrigel and inoculated subcutaneously into B-Rag2 KO rats (n=5). (A)Tumor volume. (B) Body weight change. As shown in panel A, A549 cells were able to establish tumors in B-Rag2 KO rats, indicating that B-Rag2 KO rats can be used for efficacy studies.
-
RT-112 human bladder cancer xenograft model in B-Rag2 KO rats
-
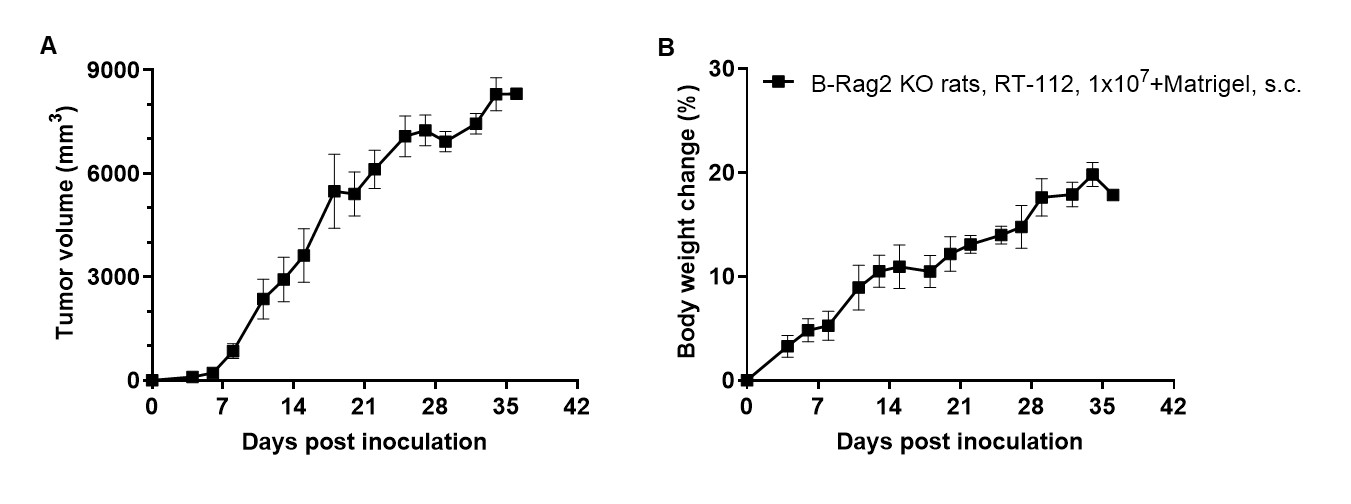
Subcutaneous homograft tumor growth of RT-112 cells in B-Rag2 KO rats. Human bladder cancer cell line RT-112 (1×10⁷) were mixed with Matrigel and inoculated subcutaneously into B-Rag2 KO rats (n=5). (A)Tumor volume. (B) Body weight change. As shown in panel A, RT-112 cells were able to establish tumors in B-Rag2 KO rats, indicating that B-Rag2 KO rats can be used for efficacy studies.
-
HCC1954 human breast cancer xenograft model in B-Rag2 KO rats
-
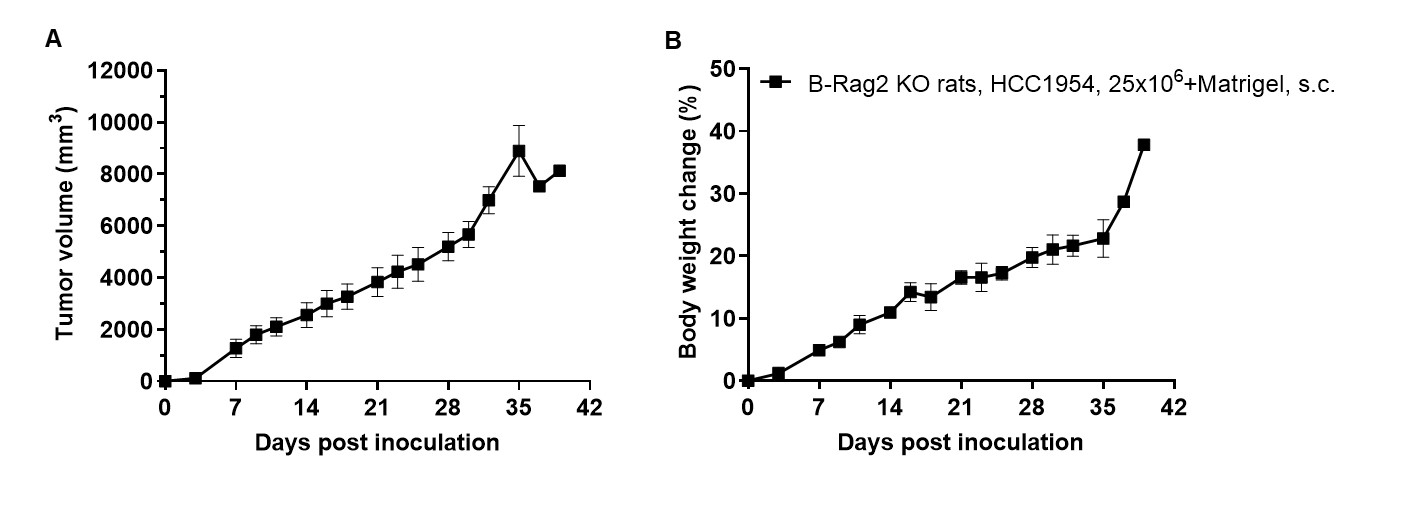
Subcutaneous homograft tumor growth of HCC1954 cells in B-Rag2 KO rats. Human breast cancer cell line HCC1954 (25×106) were mixed with Matrigel and inoculated subcutaneously into B-Rag2 KO rats (n=5). (A)Tumor volume. (B) Body weight change. As shown in panel A, HCC1954 cells were able to establish tumors in B-Rag2 KO rats, indicating that B-Rag2 KO rats can be used for efficacy studies.
