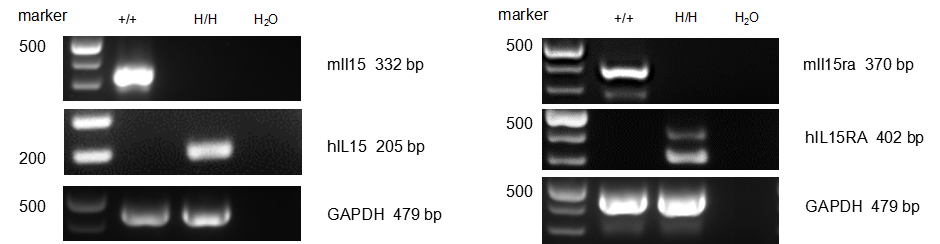
mRNA expression analysis
Strain specific analysis of IL15 and IL15RA gene expression in wild-type mice and B-hIL15/hIL15RA mice by RT-PCR. Mouse Il15 and Il15ra mRNA were detectable in spleen of wild-type mice (+/+) but not in homozygous B-hIL15/hIL15RA mice (H/H). Human IL15 and IL15RA mRNA were detectable only in homozygous B-hIL15/hIL15RA mice but not in wild-type mice.
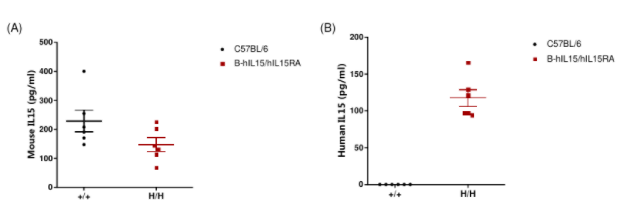
Protein expression analysis
Strain specific IL15 expression analysis in homozygous B-hIL15/hIL15RA mice by ELISA. (A) Mouse IL15; (B) Human IL15; Serum was collected from wild-type mice (+/+) and homozygous B-hIL15/hIL15RA mice (H/H), and analyzed by ELISA with IL15 ELISA kit. Human IL15 was only detectable in homozygous B-hIL15/hIL15RA mice but not in wild-type mice. Mouse IL15 was both detectable in wild-type mice and homozygous B-hIL15/hIL15RA mice. According to that mouse IL15 was not detection in homozygous B-hIL15/hIL15RA mice in mRNA level, probably the ELISA kit has cross reaction between human and mouse.
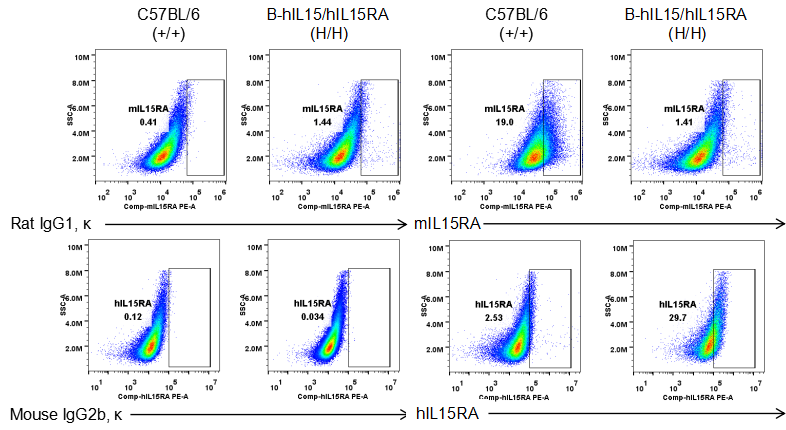
IL15RA expression analysis in homozygous B-hIL15/hIL15RA mice by flow cytometry. Dendritic cells were collected from wild-type mice (+/+) and homozygous B-hIL15/hIL15RA mice (H/H),and analyzed by flow cytometry with species-specific anti-IL15RA antibody. Mouse IL15RA was detectable in wild-type mice but not in homozygous B-hIL15/hIL15RA mice. Human IL15RA was exclusively detectable in homozygous B-hIL15/hIL15RA mice but not in wild-type mice.
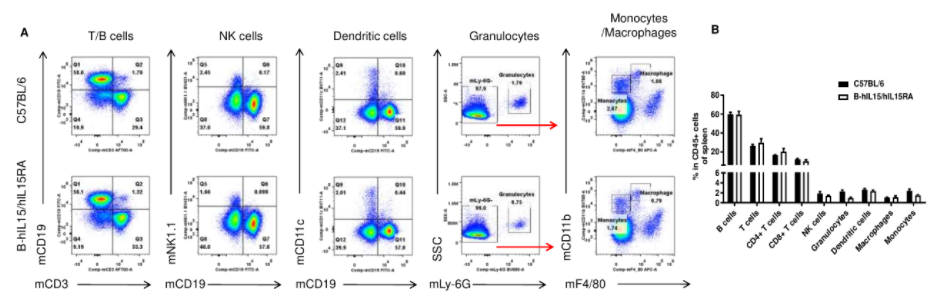
Analysis of spleen leukocytes subpopulation
Analysis of spleen leukocyte subpopulations by FACS. Splenocytes were isolated from female C57BL/6 and B-hIL15/hIL15RA mice (n=3, female, 8-week-old). Flow cytometry analysis of the splenocytes were performed to assess leukocyte subpopulations. A. Representative FACS plots. Single live cells were gated for the CD45+ population and used for further analysis as indicated here. B. Results of FACS analysis. Percent of T cells, B cells, NK cells, dendritic cells, granulocytes, monocytes and macrophages in homozygous B-hIL15/hIL15RA mice were similar to those in the C57BL/6 mice. Values are expressed as mean ± SEM.
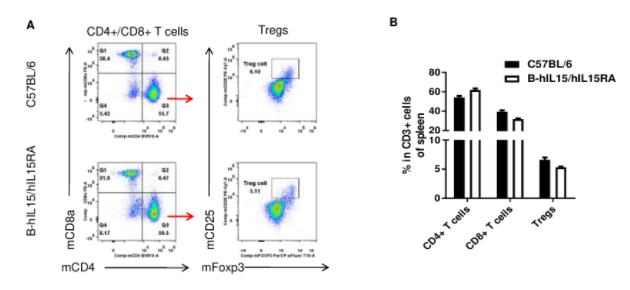
Analysis of spleen T leukocytes subpopulation
Analysis of T cell subpopulations by FACS. Splenocytes were isolated from female C57BL/6 and B-hIL15/hIL15RA mice (n=3, female, 8-week-old). The proportion of T cells subpopulation was tested by flow cytometry. A. Representative FACS plots. Single live cells were gated for the CD3+ population and used for further analysis as indicated here. B. Results of FACS analysis. Percent of CD4+ T cells, CD8+ T cells and Tregs in homozygous B-hIL15/hIL15RA mice were similar to those in the C57BL/6 mice. Values are expressed as mean ± SEM.
Analysis of blood leukocytes subpopulation
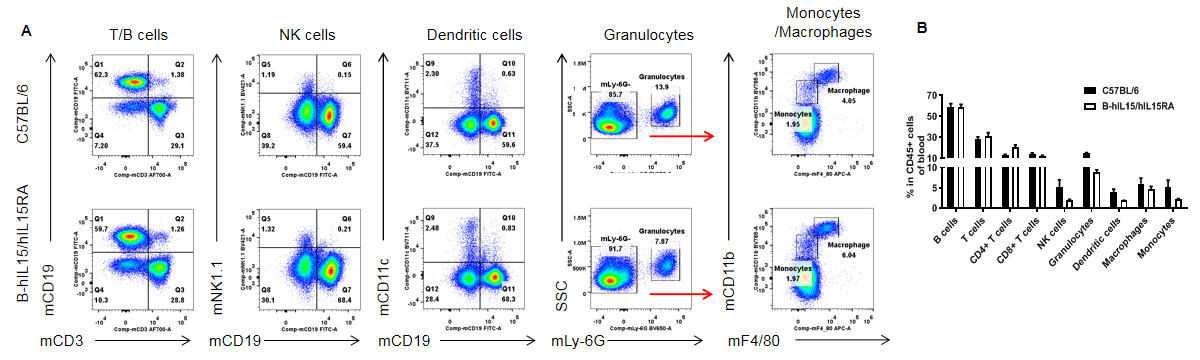
Analysis of blood leukocyte subpopulations by FACS. Blood cells were isolated from female C57BL/6 and B-hIL15/hIL15RA mice (n=3, female, 8-week-old). Flow cytometry analysis of the blood cells were performed to assess leukocyte subpopulations. A. Representative FACS plots. Single live cells were gated for the CD45+ population and used for further analysis as indicated here. B. Results of FACS analysis. Percent of T cells, B cells, NK cells, dendritic cells, granulocytes, monocytes and macrophages in homozygous B-hIL15/hIL15RA mice were similar to those in the C57BL/6 mice. Values are expressed as mean ± SEM.
Analysis of blood T leukocytes subpopulation
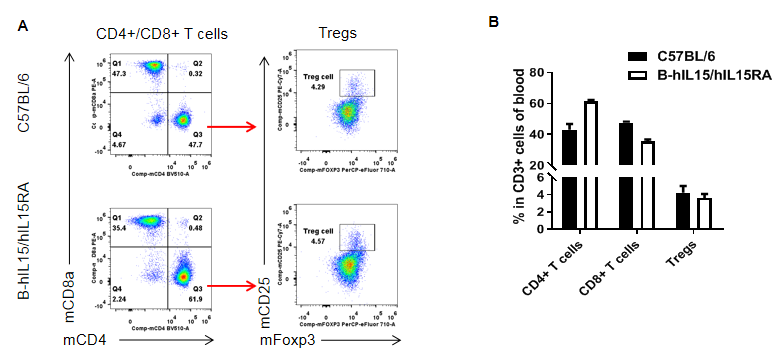
Analysis of T cell subpopulations by FACS. Blood cells were isolated from female C57BL/6 and B-hIL15/hIL15RA mice (n=3, female, 8-week-old). The proportion of T cells subpopulation was tested by flow cytometry. A. Representative FACS plots. Single live cells were gated for the CD3+ population and used for further analysis as indicated here. B. Results of FACS analysis. Percent of CD4+ T cells, CD8+ T cells and Tregs in homozygous B-hIL15/hIL15RA mice were similar to those in the C57BL/6 mice. Values are expressed as mean ± SEM.
Analysis of lymph node leukocytes subpopulation
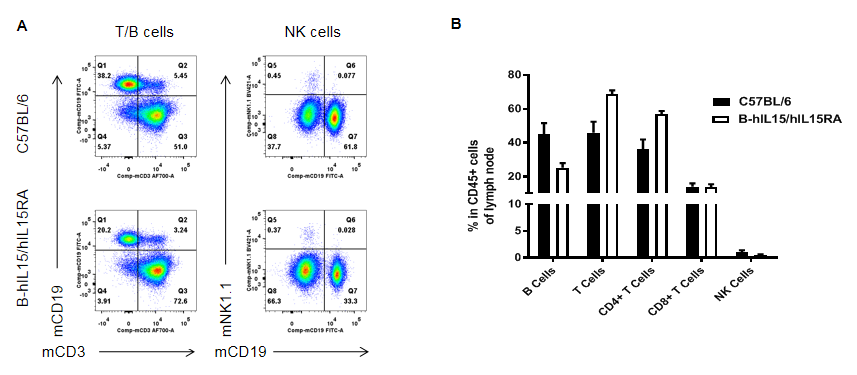
Analysis of lymph node leukocyte subpopulations by FACS. Lymph node cells were isolated from female C57BL/6 and B-hIL15/hIL15RA mice (n=3, female, 8-week-old). Flow cytometry analysis of the lymph node cells were performed to assess leukocyte subpopulations. A. Representative FACS plots. Single live cells were gated for the CD45+ population and used for further analysis as indicated here. B. Results of FACS analysis. Percent of T cells, B cells, NK cells, CD4+ T cells and CD8+ T cells in homozygous B-hIL15/hIL15RA mice were similar to those in the C57BL/6 mice. Values are expressed as mean ± SEM.
Analysis of lymph node T leukocytes subpopulation
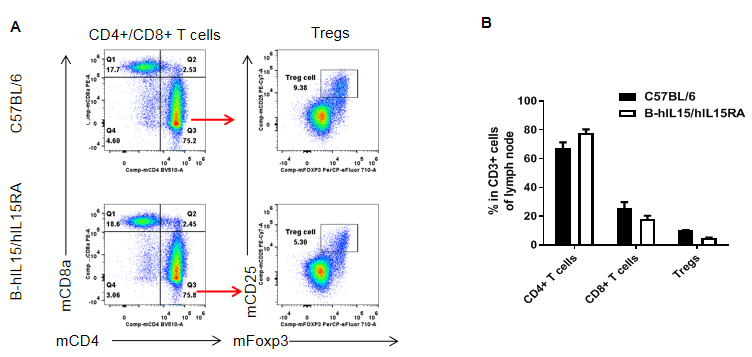
Analysis of T cell subpopulations by FACS. Lymph node cells were isolated from female C57BL/6 and B-hIL15/hIL15RA mice (n=3, female, 8-week-old). The proportion of T cells subpopulation was tested by flow cytometry. A. Representative FACS plots. Single live cells were gated for the CD3+ population and used for further analysis as indicated here. B. Results of FACS analysis. Percent of CD4+ T cells, CD8+ T cells and Tregs in homozygous B-hIL15/hIL15RA mice were similar to those in the C57BL/6 mice. Values are expressed as mean ± SEM.
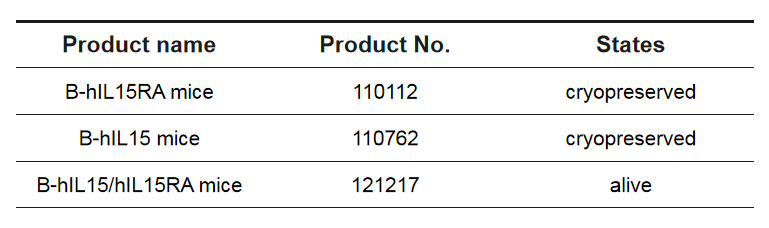
* When publishing results obtained using this animal model, please acknowledge the source as follows: The animal model [B-hIL15/hIL15RA mice] (Cat# 121217) was purchased from Biocytogen.