
Basic Information
-
Gene targeting strategy

-
Gene targeting strategy for B-hLAIR1 mice. The exons 3-4 of mouse Lair1 gene that encode the extracellular domain were replaced by human LAIR1 exons 3-6 in B-hLAIR1 mice.
-
Protein expression analysis
-
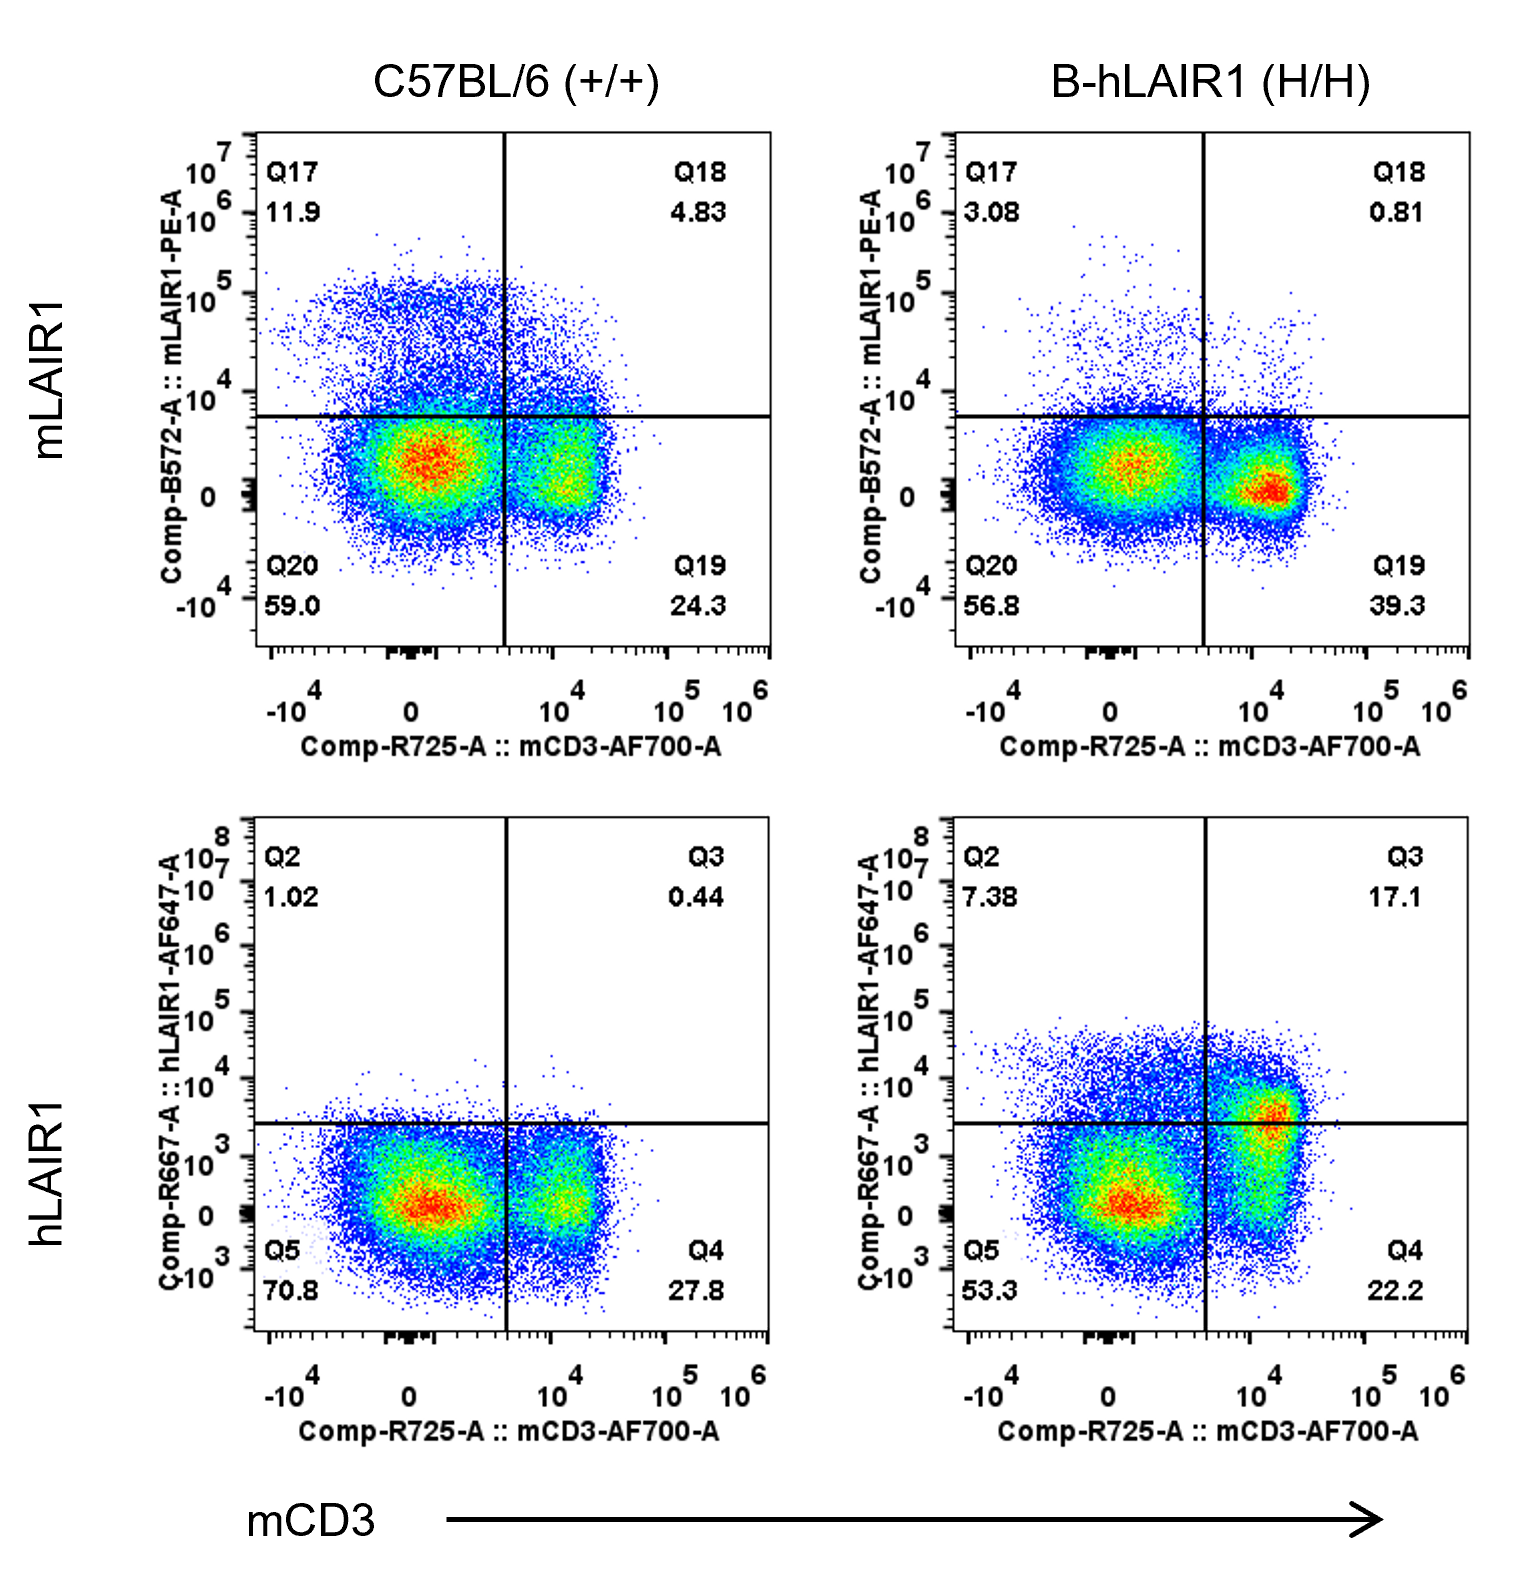
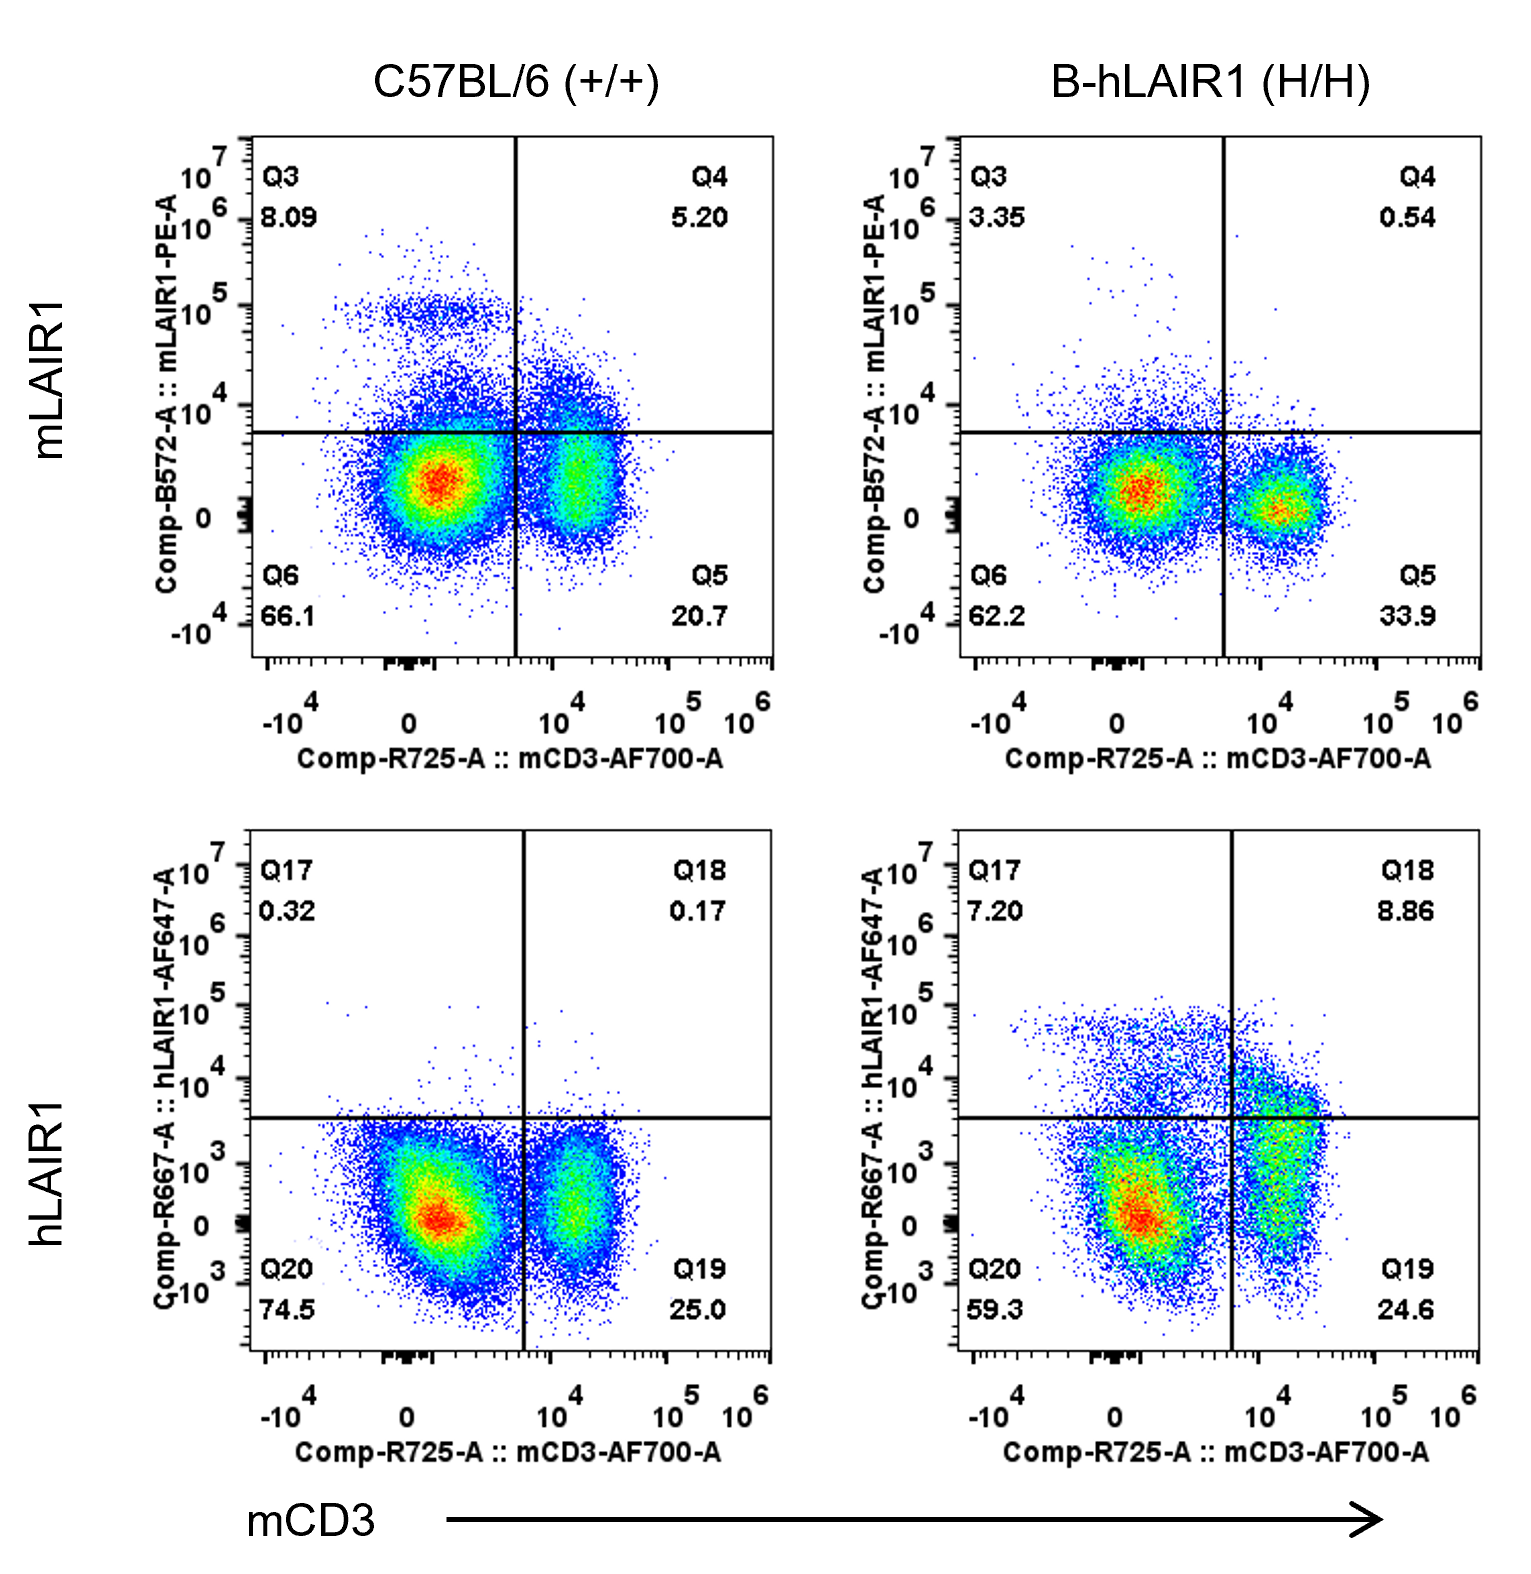
Species-specific LAIR1 protein expression analysis in wild-type and humanized B-hLAIR1 mice. Splenic T cells were isolated from wild-type C57BL/6 (+/+) and homozygous B-hLAIR1 (H/H) mice and analyzed by flow cytometry using species-specific anti-LAIR1 antibodies. Murine LAIR1 protein was detected in wild-type mice, while human LAIR1 protein was detected in B-hLAIR1 mice.
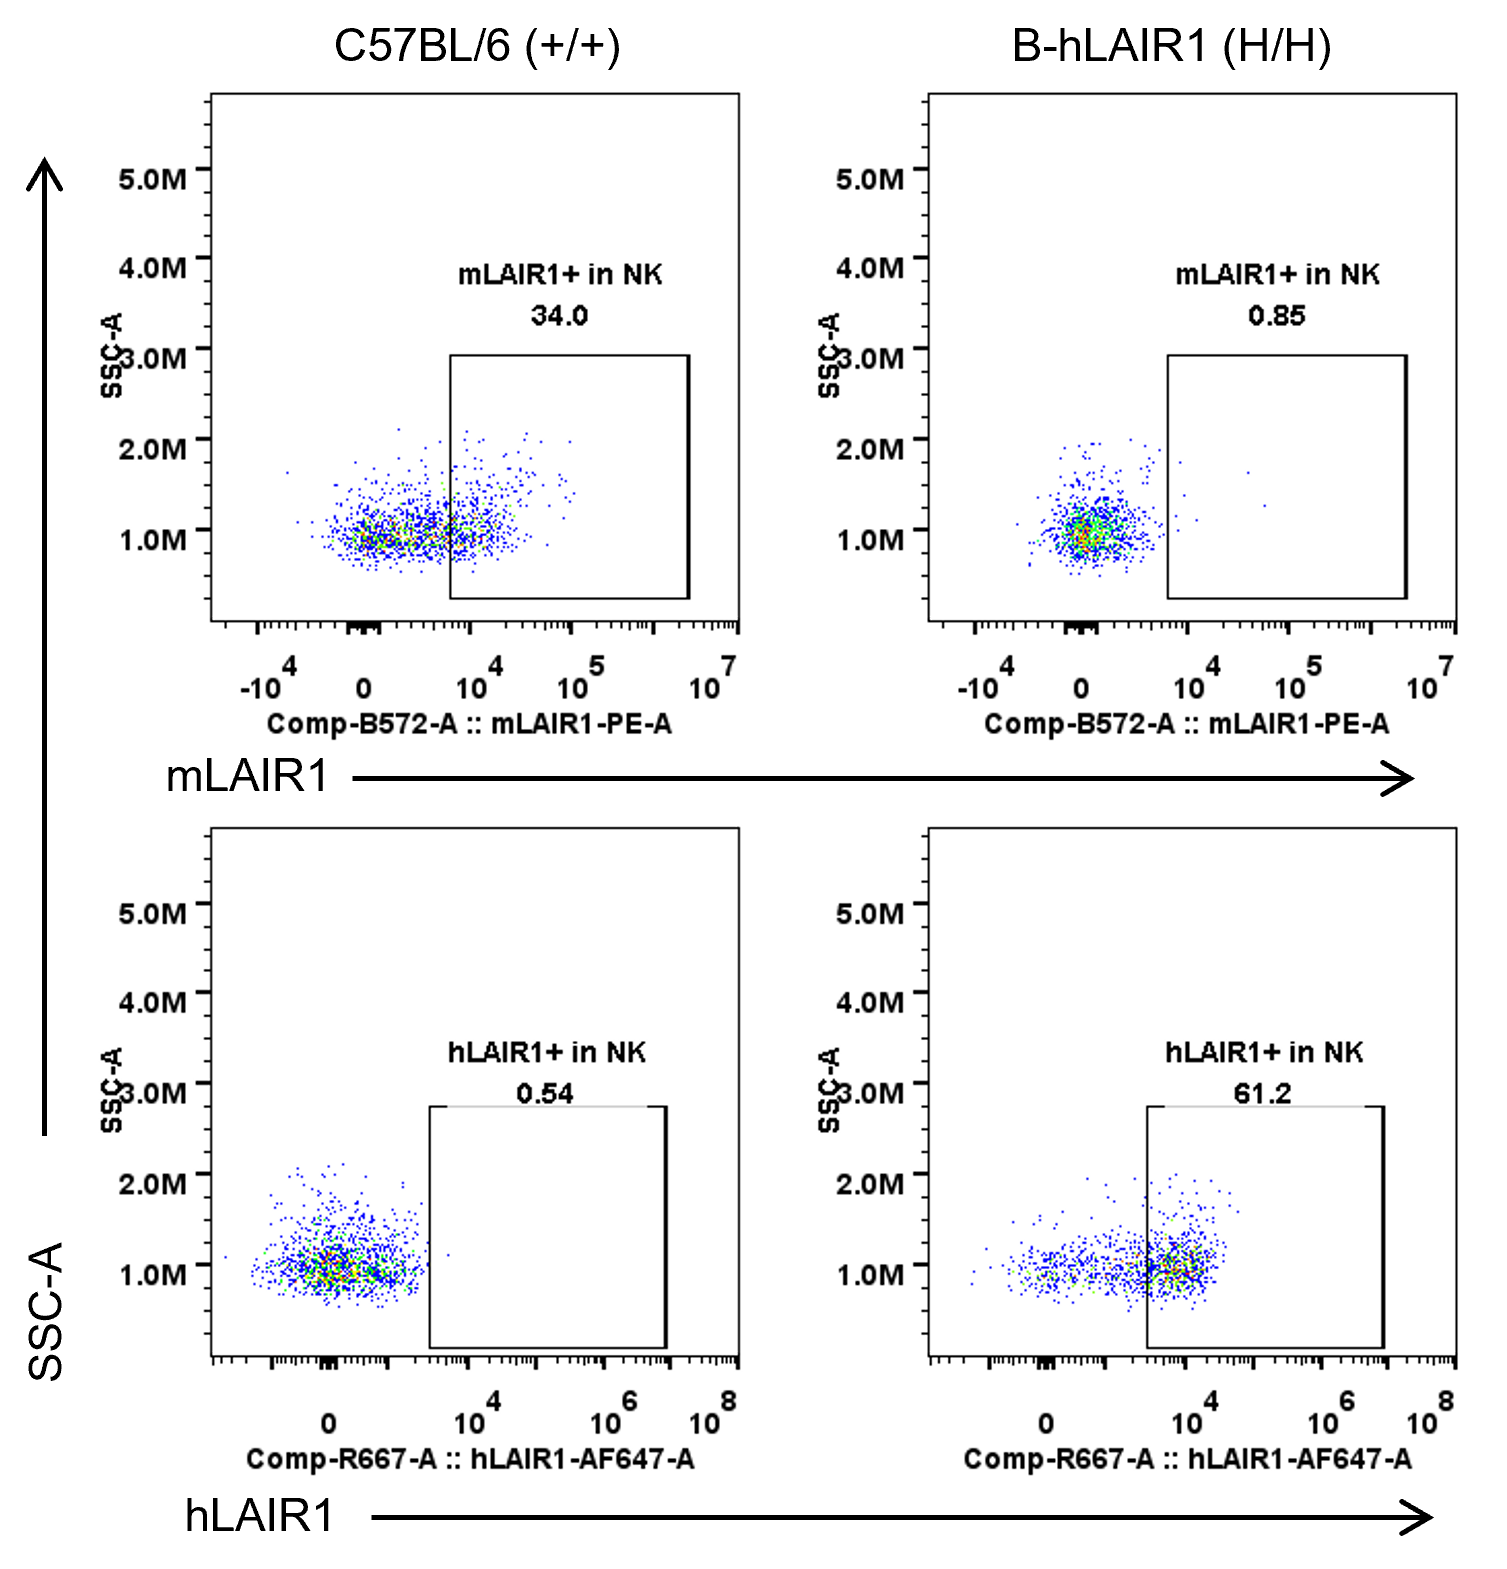
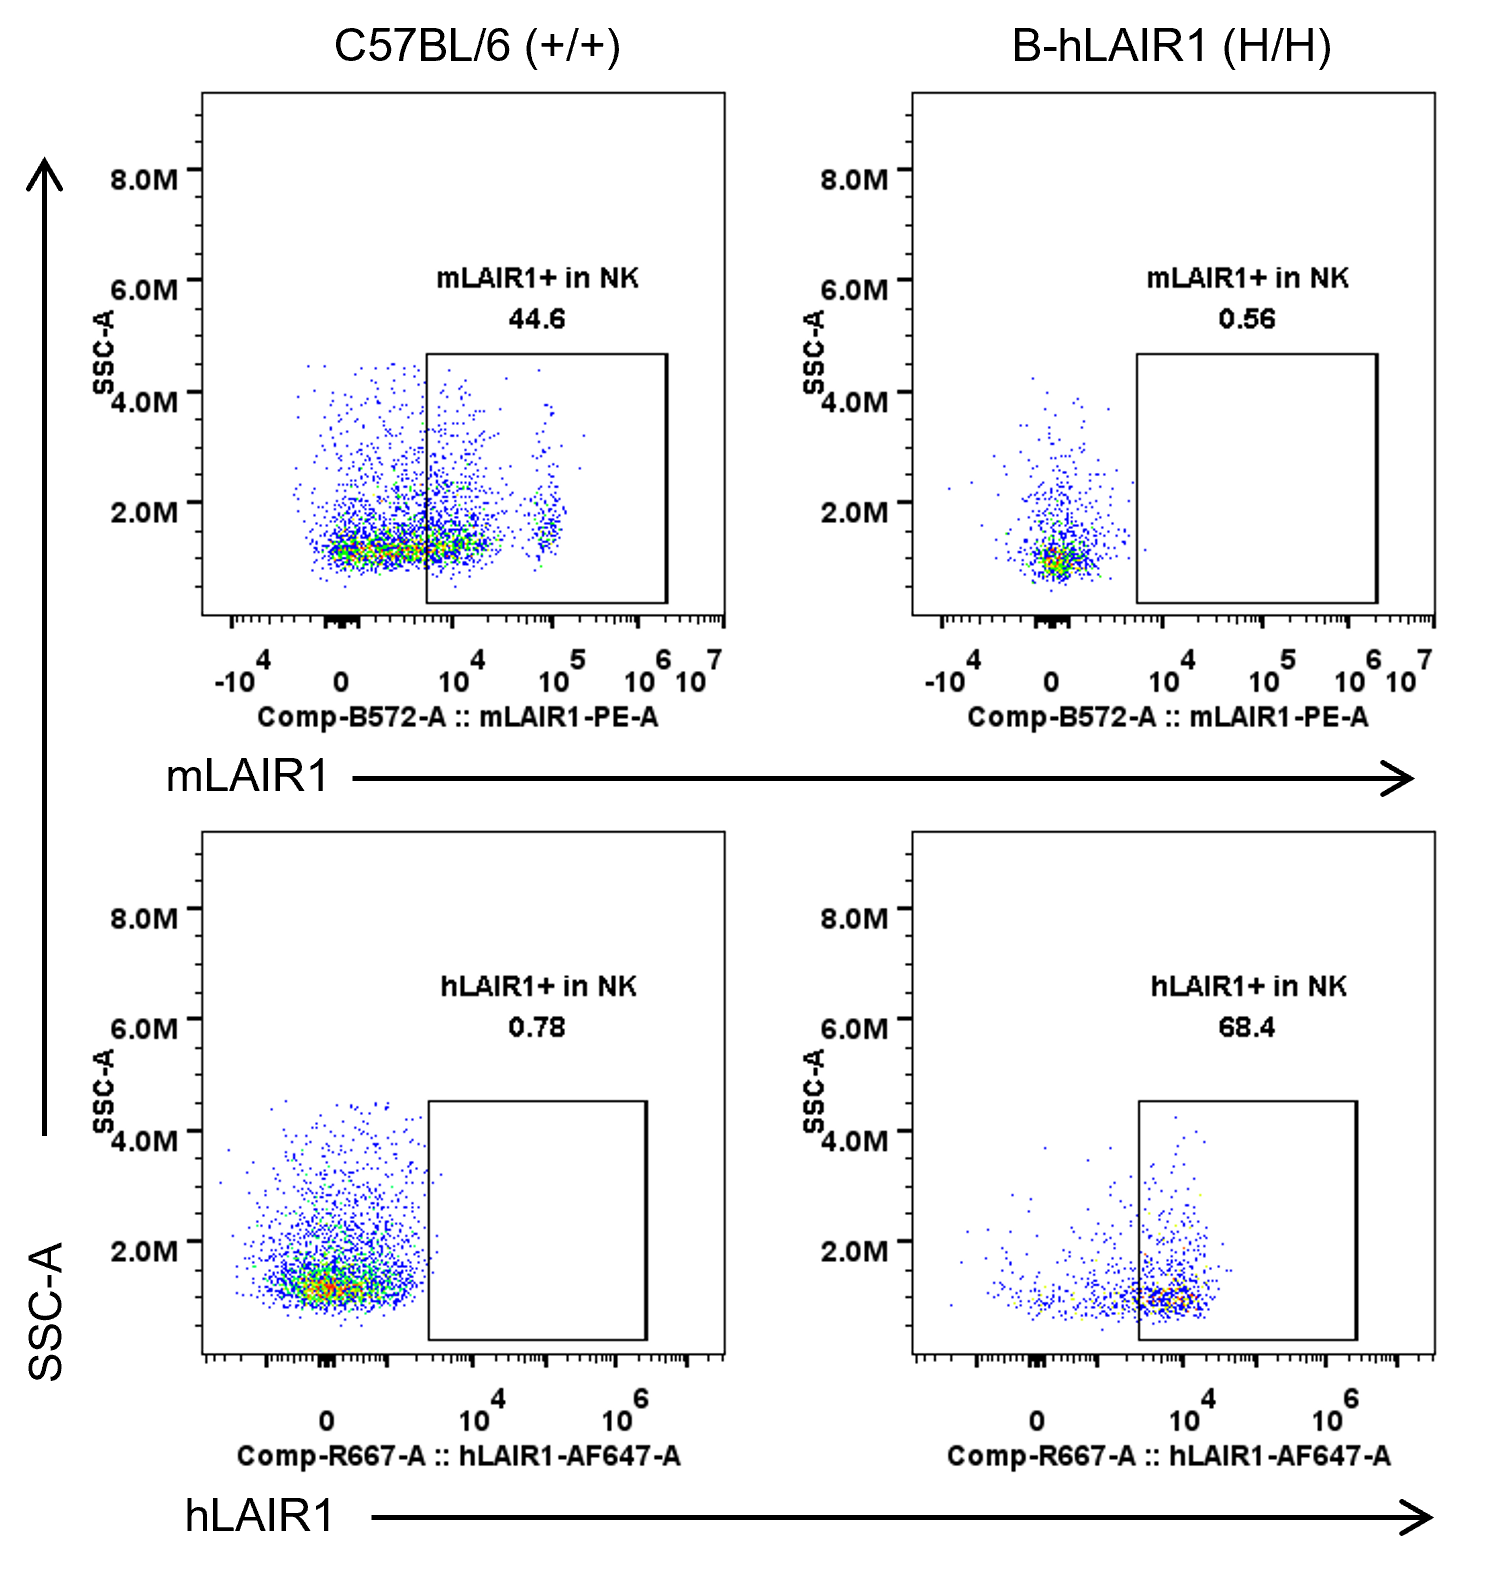
Species-specific LAIR1 protein expression analysis in wild-type and humanized B-hLAIR1 mice. Splenic NK cells were isolated from wild-type C57BL/6 (+/+) and homozygous B-hLAIR1 (H/H) mice and analyzed by flow cytometry using species-specific anti-LAIR1 antibodies. Murine LAIR1 protein was detected in wild-type mice, while human LAIR1 protein was detected in B-hLAIR1 mice.
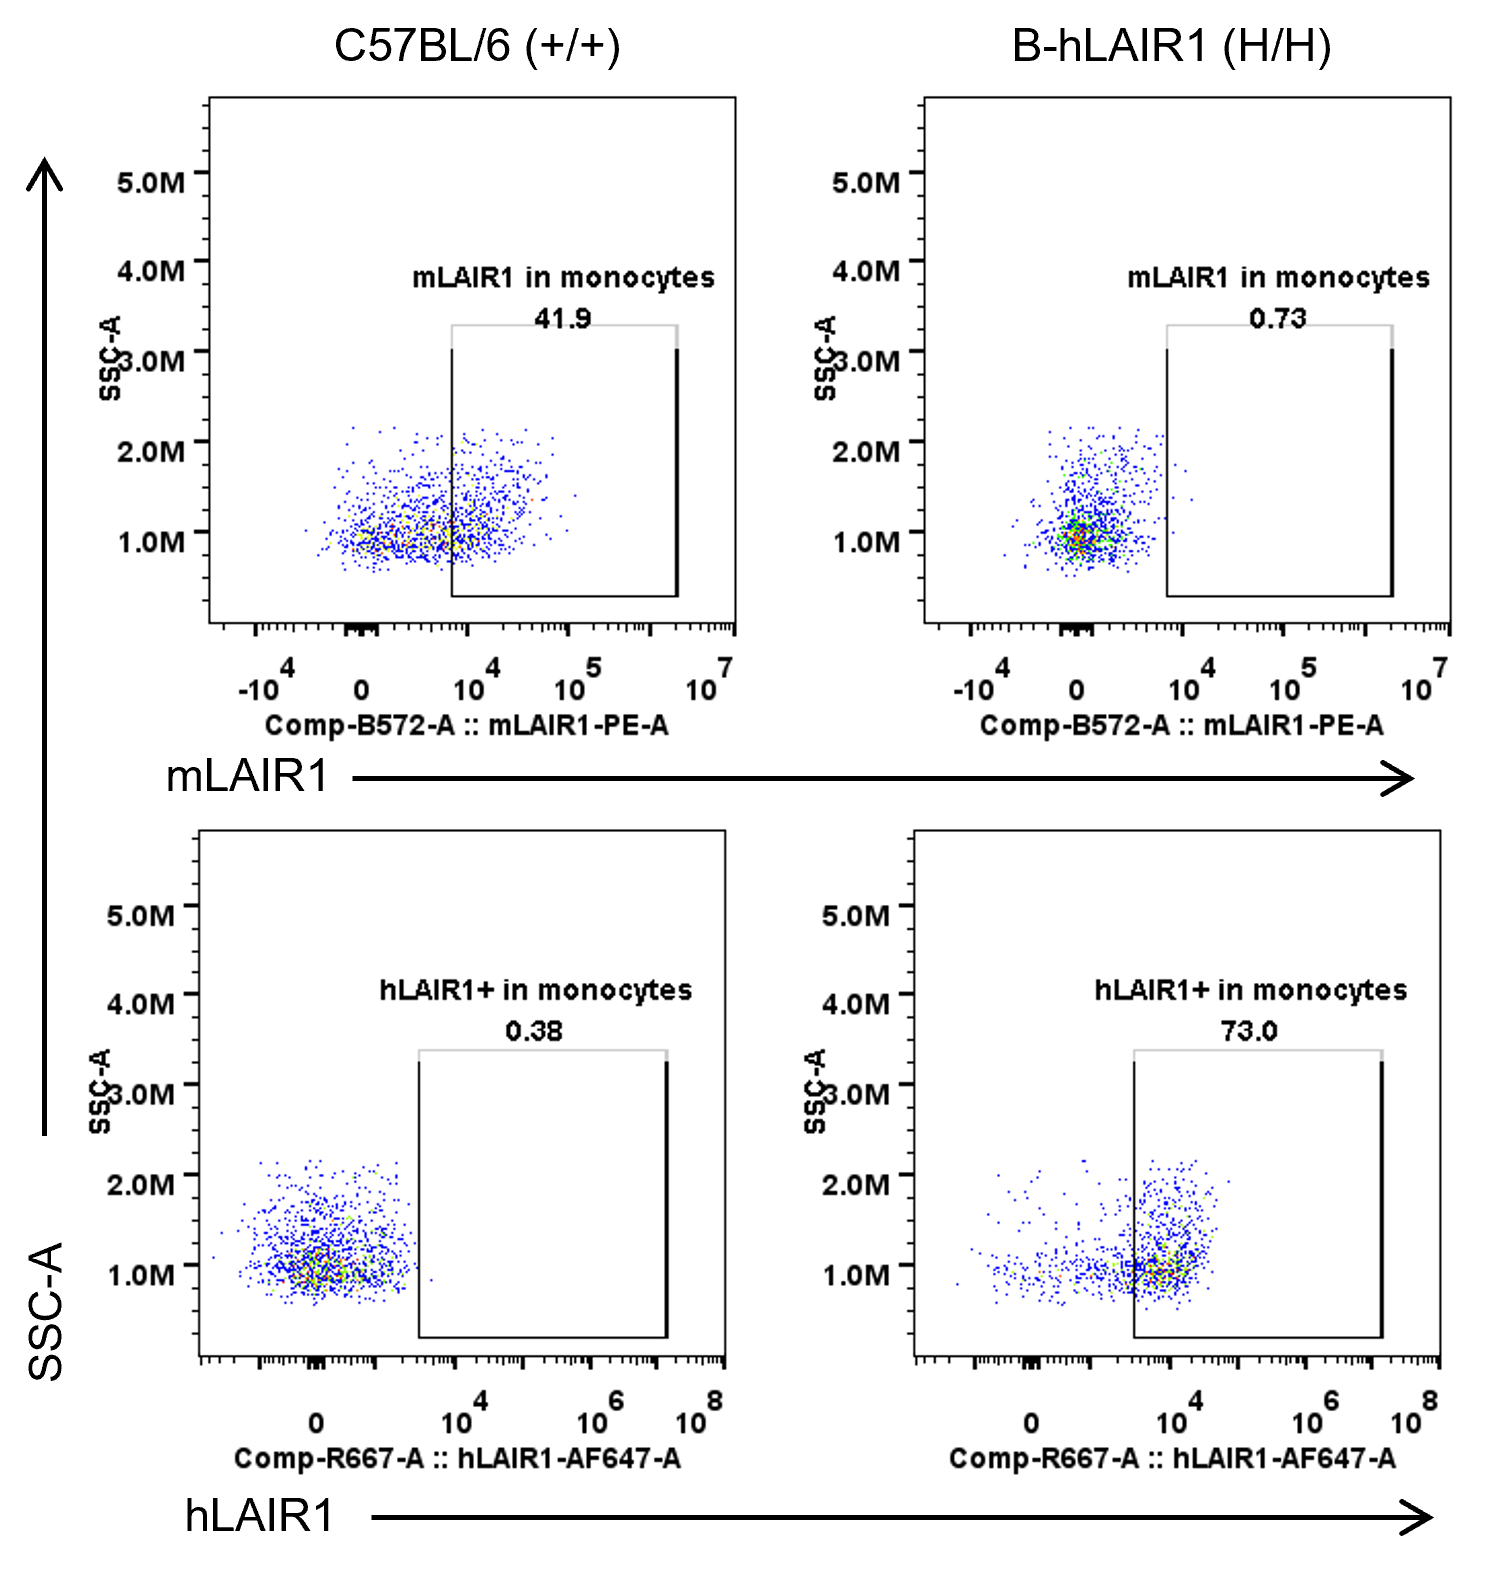
Species-specific LAIR1 protein expression analysis in wild-type and humanized B-hLAIR1 mice. Splenic monocytes were isolated from wild-type C57BL/6 (+/+) and homozygous B-hLAIR1 (H/H) mice and analyzed by flow cytometry using species-specific anti-LAIR1 antibodies. Murine LAIR1 protein was detected in wild-type mice, while human LAIR1 protein was detected in B-hLAIR1 mice.
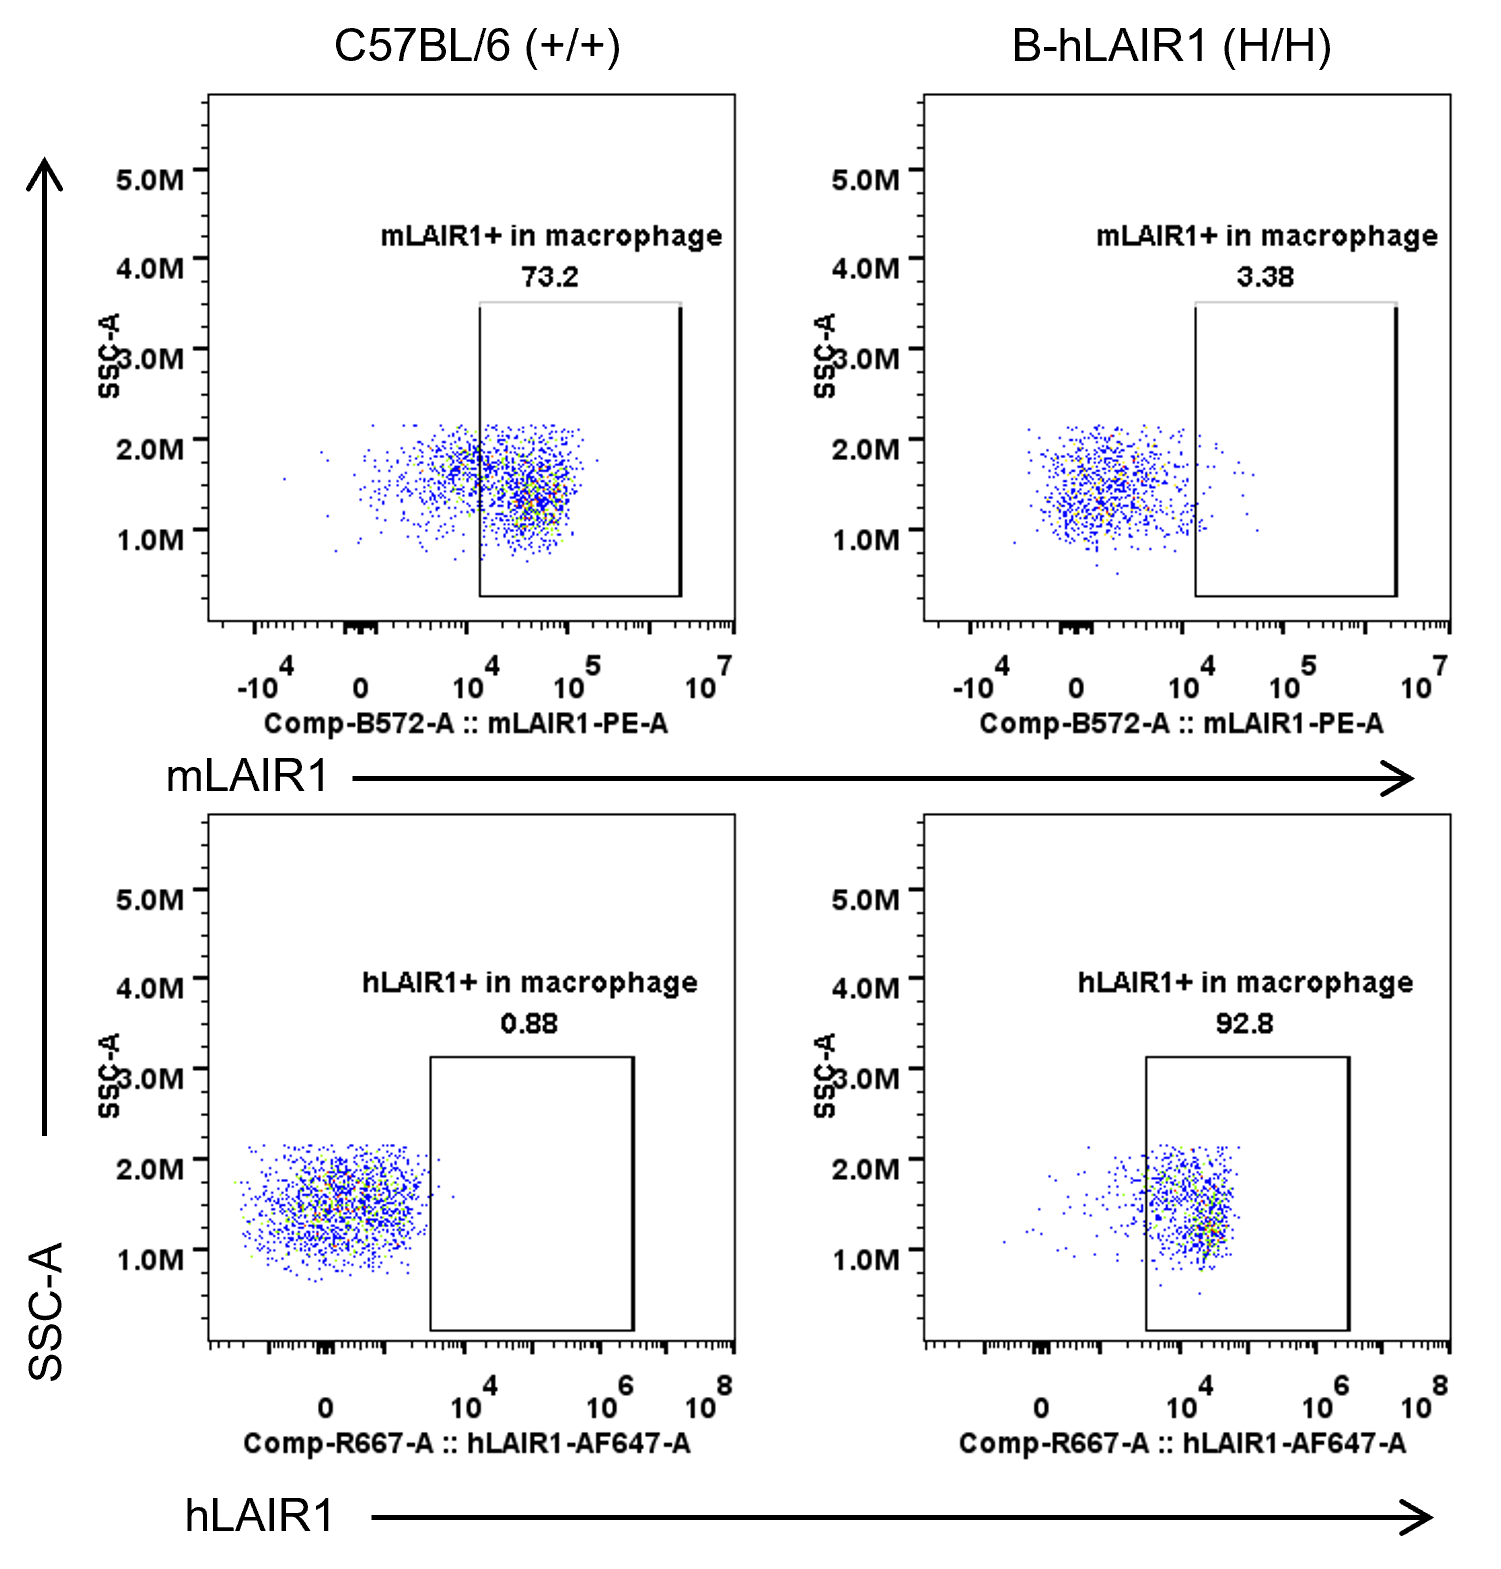
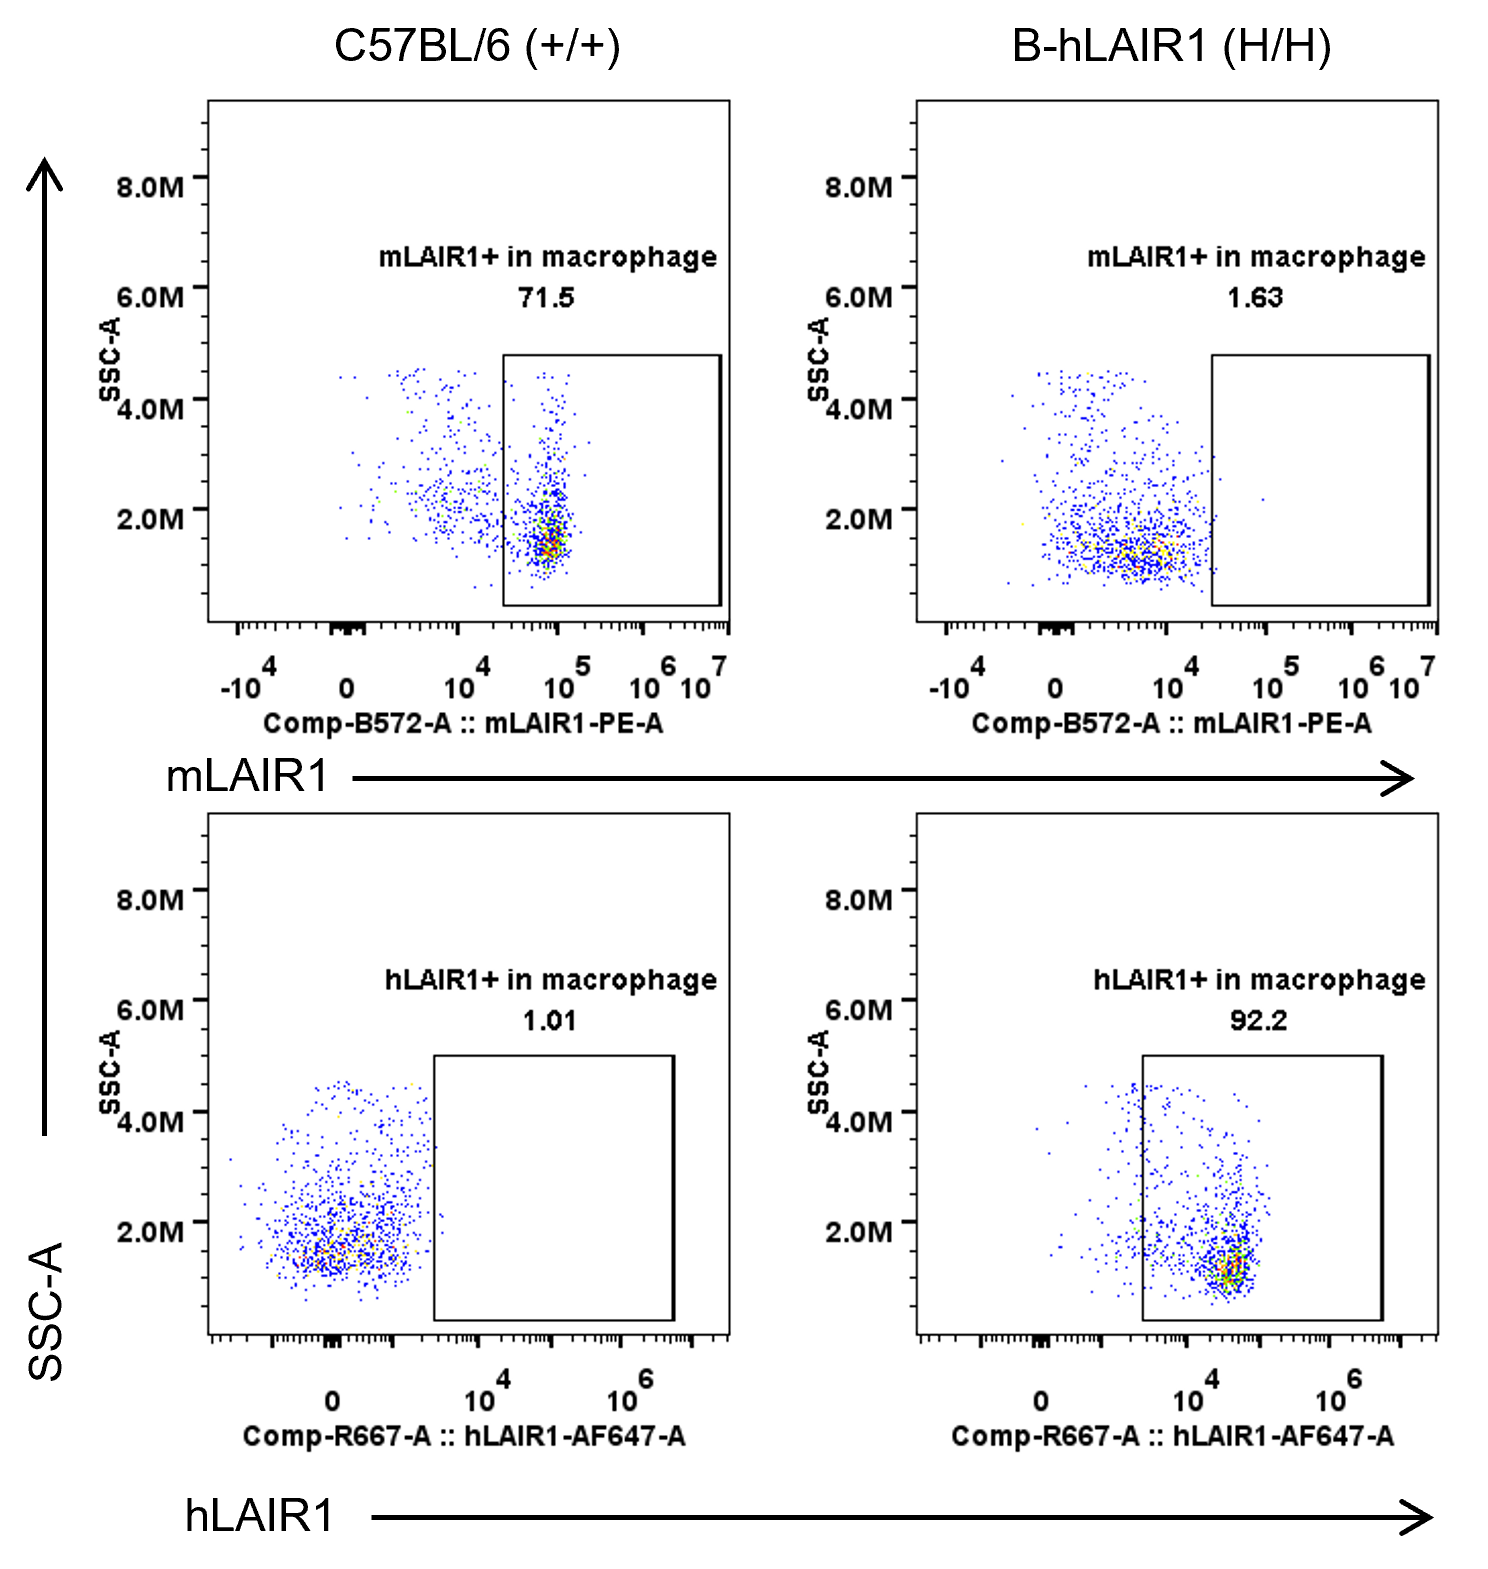
Species-specific LAIR1 protein expression analysis in wild-type and humanized B-hLAIR1 mice. Splenic macrophages were isolated from wild-type C57BL/6 (+/+) and homozygous B-hLAIR1 (H/H) mice and analyzed by flow cytometry using species-specific anti-LAIR1 antibodies. Murine LAIR1 protein was detected in wild-type mice, while human LAIR1 protein was detected in B-hLAIR1 mice.
Species-specific LAIR1 protein expression analysis in wild-type and humanized B-hLAIR1 mice. Blood T cells were isolated from wild-type C57BL/6 (+/+) and homozygous B-hLAIR1 (H/H) mice and analyzed by flow cytometry using species-specific anti-LAIR1 antibodies. Murine LAIR1 protein was detected in wild-type mice, while human LAIR1 protein was detected in B-hLAIR1 mice.
Species-specific LAIR1 protein expression analysis in wild-type and humanized B-hLAIR1 mice. Blood NK cells were isolated from wild-type C57BL/6 (+/+) and homozygous B-hLAIR1 (H/H) mice and analyzed by flow cytometry using species-specific anti-LAIR1 antibodies. Murine LAIR1 protein was detected in wild-type mice, while human LAIR1 protein was detected in B-hLAIR1 mice.

Species-specific LAIR1 protein expression analysis in wild-type and humanized B-hLAIR1 mice. Blood monocytes were isolated from wild-type C57BL/6 (+/+) and homozygous B-hLAIR1 (H/H) mice and analyzed by flow cytometry using species-specific anti-LAIR1 antibodies. Murine LAIR1 protein was detected in wild-type mice, while human LAIR1 protein was detected in B-hLAIR1 mice.
Species-specific LAIR1 protein expression analysis in wild-type and humanized B-hLAIR1 mice. Blood macrophages were isolated from wild-type C57BL/6 (+/+) and homozygous B-hLAIR1 (H/H) mice and analyzed by flow cytometry using species-specific anti-LAIR1 antibodies. Murine LAIR1 protein was detected in wild-type mice, while human LAIR1 protein was detected B-hLAIR1 mice.
