
Basic Information
-
Targeting strategy

-
Gene targeting strategy for B-hCCR8 mice(C). The full coding sequence and 3’UTR of mouse Ccr8 gene was replaced by human CCR8 counterpart gene in B-hCCR8 mice(C).
-
mRNA expression analysis
-
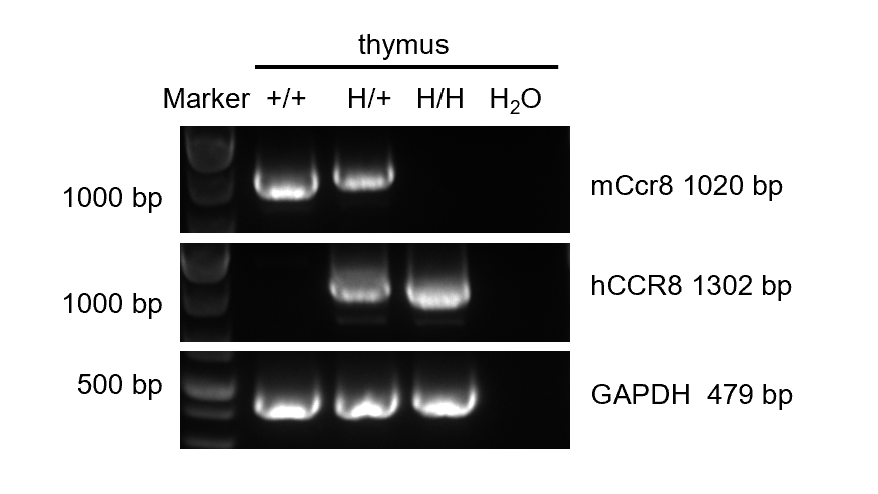
Strain specific analysis of CCR8 mRNA expression in wild-type BALB/c mice and B-hCCR8 mice(C) by RT-PCR. Thymus RNA was isolated from wild-type BALB/c mice (+/+), heterozygous (H/+) and homozygous B-hCCR8 mice(C) (H/H), then cDNA libraries were synthesized by reverse transcription, followed by PCR with mouse or human CCR8 primers. Mouse Ccr8 mRNA was detectable in wild-type BALB/c mice and heterozygous B-hCCR8 mice(C). Human CCR8 mRNA was detectable in heterozygous and homozygous B-hCCR8 mice(C) but not in wild-type mice.
-
CCR8 expression in spleen and thymus
-
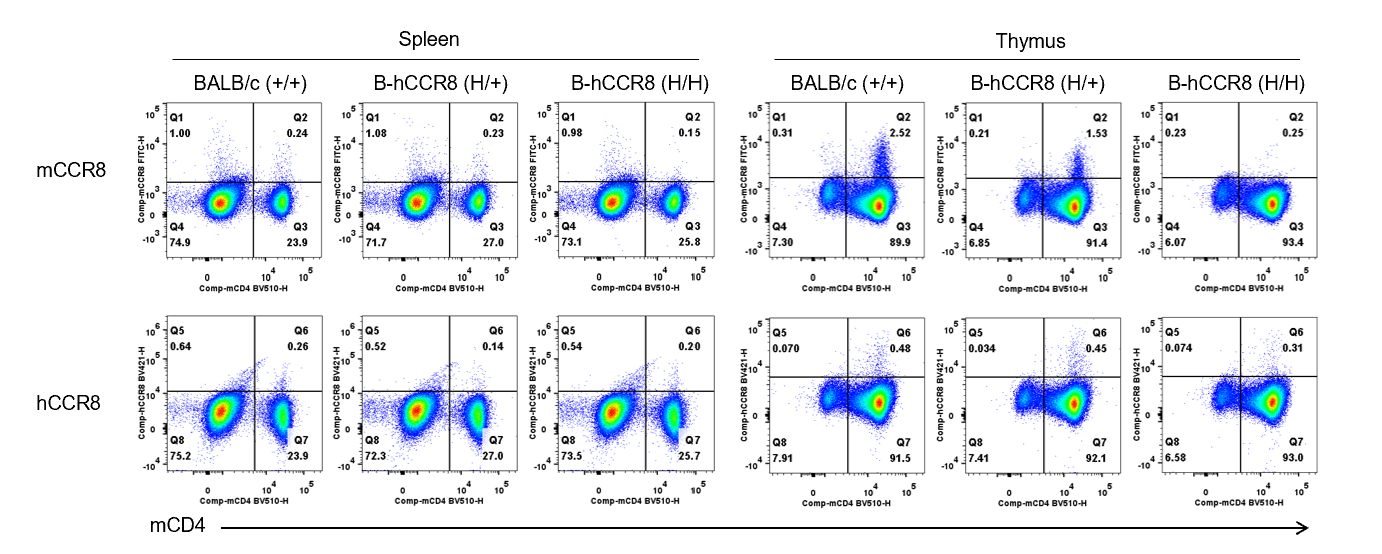
Strain specific CCR8 expression analysis in B-hCCR8 mice(C) by flow cytometry. Splenocytes and thymocytes were collected from wild-type BALB/c mice (+/+), heterozygous (H/+) and homozygous (H/H) B-hCCR8 mice(C), and analyzed by flow cytometry with anti-CCR8 antibody. Mouse CCR8 was detectable in T cells of thymocytes that collected from wild-type and heterozygous mice, while not detectable in T cells of splenocytes. Human CCR8 was not detectable in T cells of thymocytes and splenocytes from homozygous mice.
-
hCCR8 (hCD198) expression in spleen
-
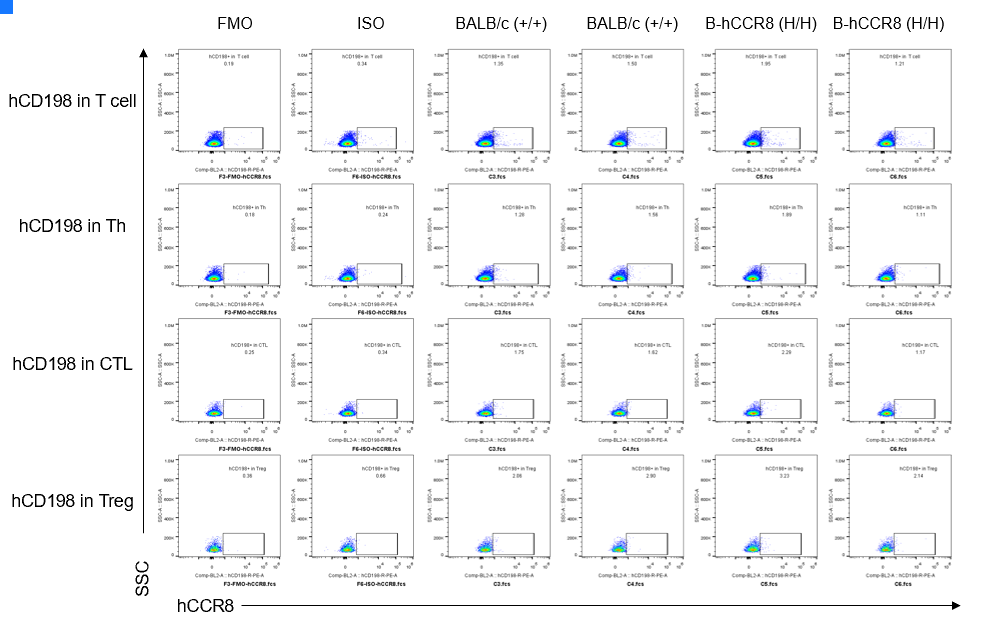
CCR8 expression analysis in B-hCCR8 mice(C) by FACS. Colon cancer CT26.WT cells were inoculated into wild-type BALB/c (+/+) and homozygous B-hCCR8 mice(C) (H/H). Spleen cells were harvested after tumor growth and analyzed by flow cytometry. Human CCR8 was not detectable in homozygous B-hCCR8 mice(C) and wild-type BALB/c mice. (Biolegend, Anti-hCCR8 ab Cat. 360604)
-
mCCR8 (mCD198) expression in spleen
-
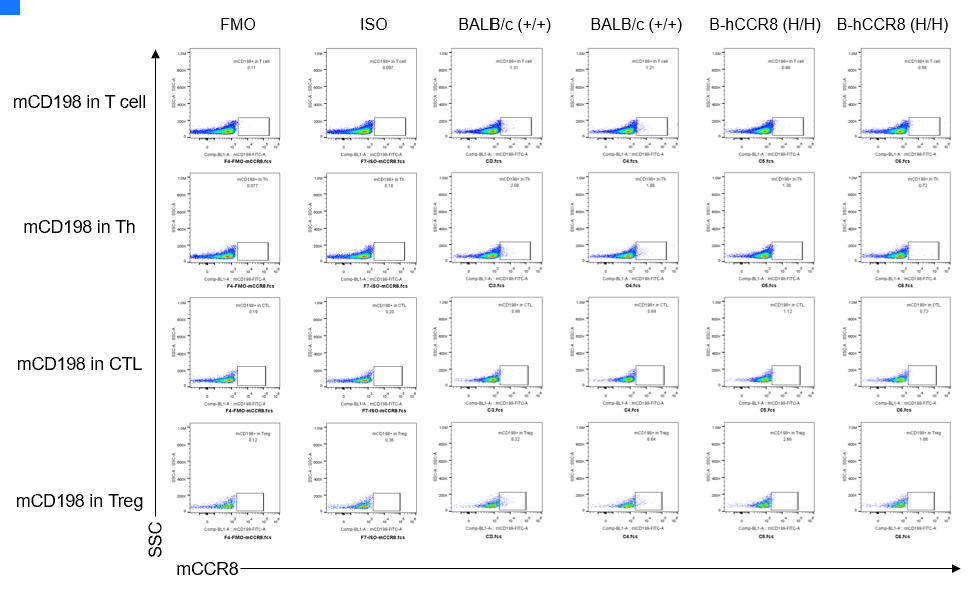
CCR8 expression analysis in B-hCCR8 mice(C) by FACS. Colon cancer CT26.WT cells were inoculated into wild-type BALB/c (+/+) and homozygous B-hCCR8 mice(C) (H/H). Spleen cells were harvested after tumor growth and analyzed by flow cytometry. Mouse CCR8 was not detectable in homozygous B-hCCR8 mice(C) and wild-type BALB/c mice. (Biolegend, Anti-mCCR8 ab Cat. 150314)
-
hCCR8 expression in tumor infiltrating cells
-
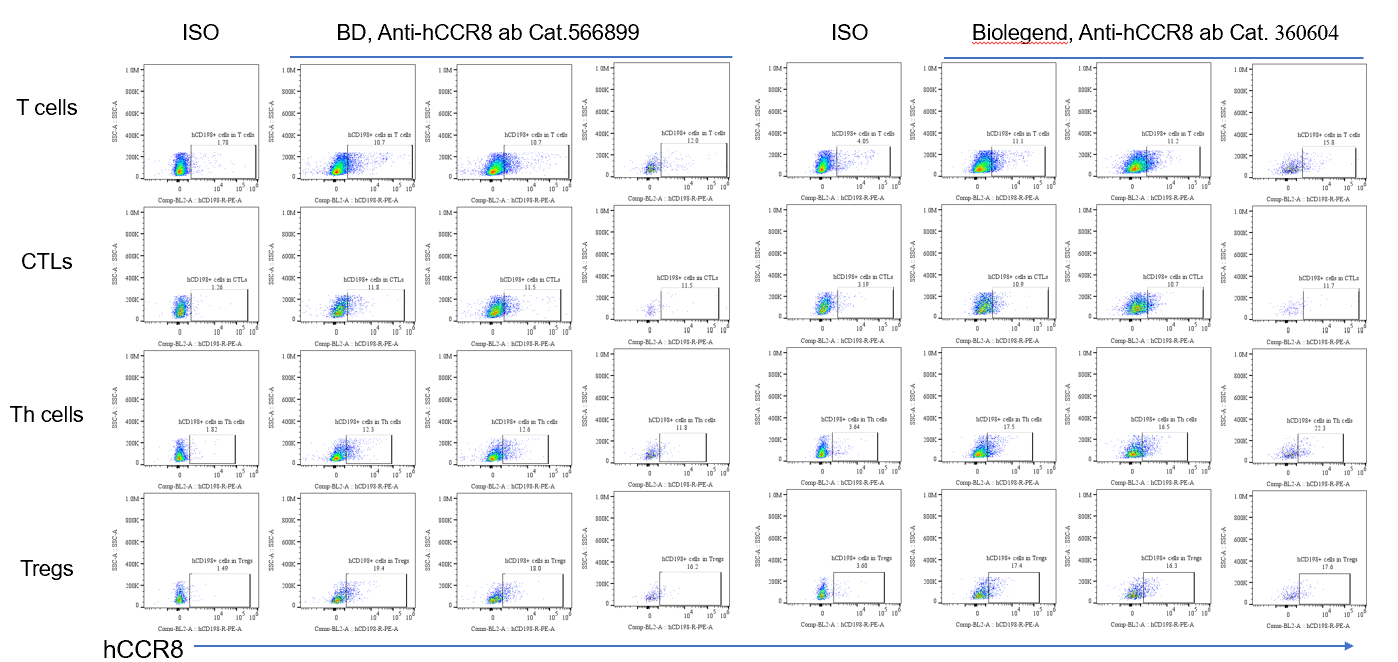
-
MFI of hCCR8 expression in tumor infiltrating cells
-
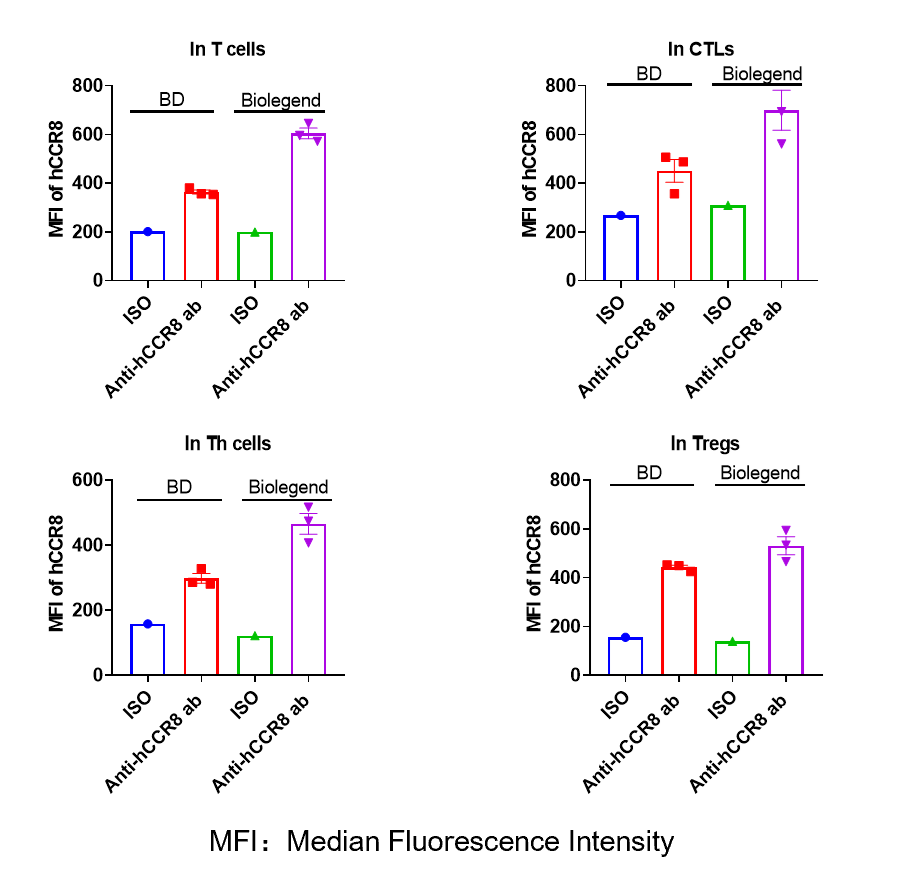
-
Analysis of leukocytes cell subpopulation in spleen
-
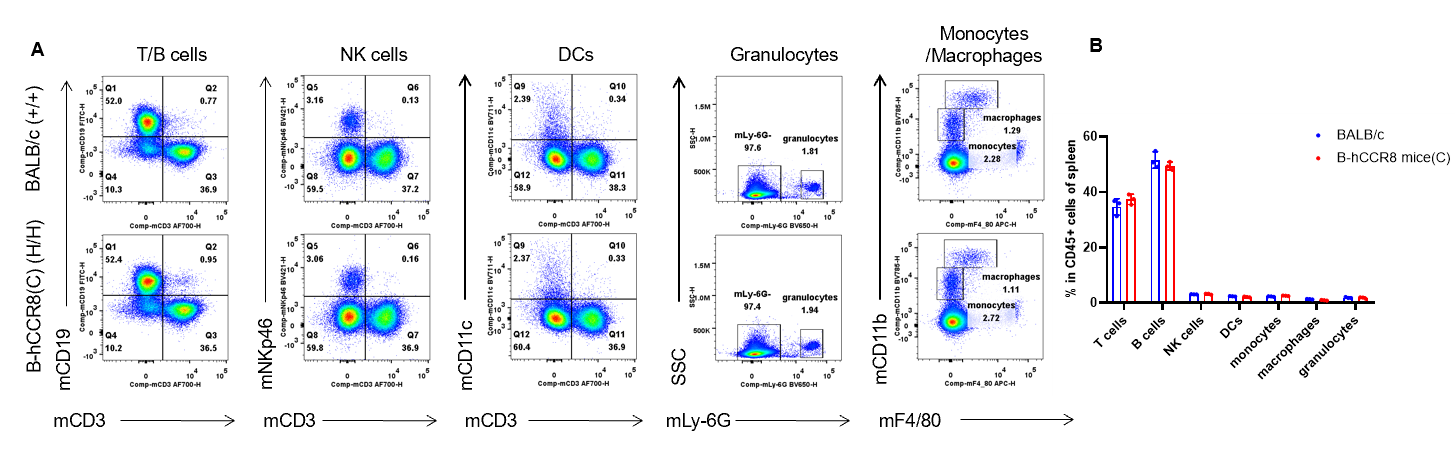
Analysis of spleen leukocyte subpopulations by flow cytometry. Splenocytes were isolated from female BALB/c and B-hCCR8 mice(C) (n=3, 7-week-old). Flow cytometry analysis of the splenocytes was performed to assess leukocyte subpopulations. A. Representative FACS plots. Single live cells were gated for the CD45+ population and used for further analysis as indicated here. B. Results of FACS analysis. Percent of T cells, B cells, NK cells, DCs, granulocytes, monocytes and macrophages in homozygous B-hCCR8 mice(C) were similar to those in the BALB/c mice, demonstrating that CCR8 humanized does not change the overall development, differentiation or distribution of these cell types in spleen. Values are expressed as mean ± SEM.
-
Analysis of T cell subpopulation in spleen
-
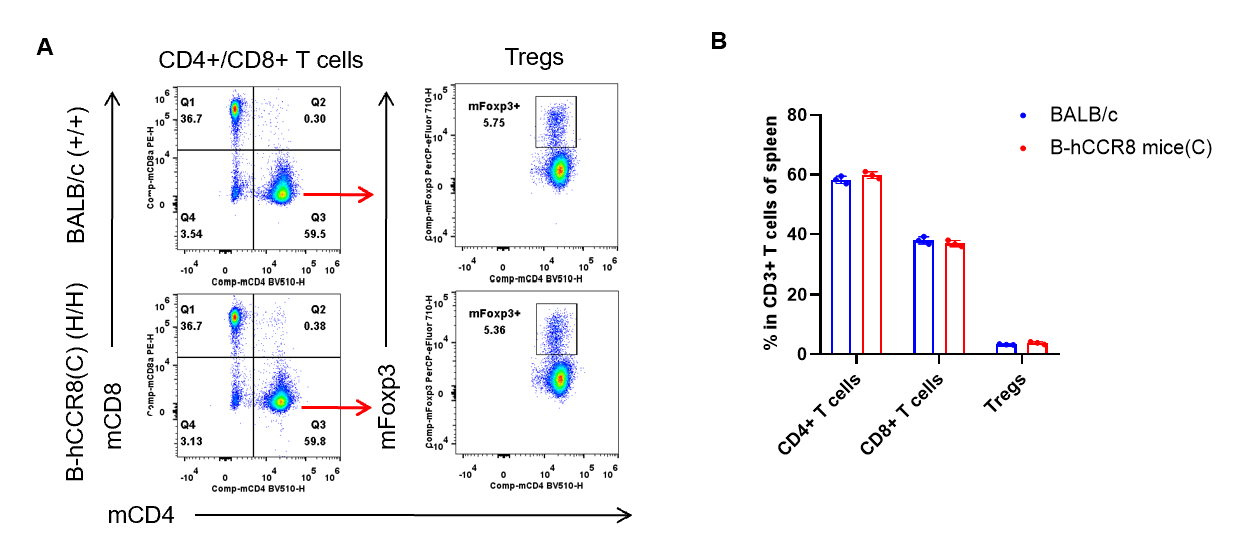
Analysis of spleen T cell subpopulations by flow cytometry. Splenocytes were isolated from female BALB/c and B-hCCR8 mice(C) (n=3, 7-week-old). Flow cytometry analysis of the leukocytes was performed to assess leukocyte subpopulations. A. Representative FACS plots. Single live CD45+ cells were gated for CD3+ T cell population and used for further analysis as indicated here. B. Results of FACS analysis. The percent of CD8+ T cells, CD4+ T cells, and Tregs in homozygous B-hCCR8 mice(C) were similar to those in the BALB/c mice, demonstrating that introduction of hCCR8 in place of its mouse counterpart does not change the overall development, differentiation or distribution of these T cell subtypes in spleen. Values are expressed as mean ± SEM.
-
Analysis of leukocytes cell subpopulation in blood
-
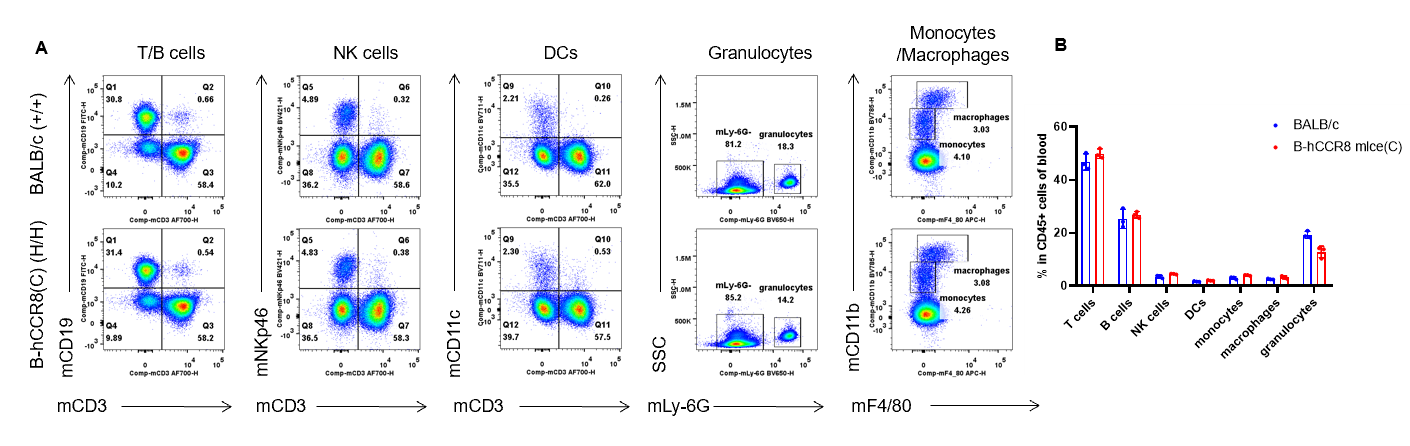
Analysis of blood leukocyte subpopulations by flow cytometry. Blood were isolated from female BALB/c and B-hCCR8 mice(C) (n=3, 7-week-old). Flow cytometry analysis of the leukocytes was performed to assess leukocyte subpopulations. A. Representative FACS plots. Single live cells were gated for the CD45+ population and used for further analysis as indicated here. B. Results of FACS analysis. Percent of T cells, B cells, NK cells, DCs, granulocytes, monocytes and macrophages in homozygous B-hCCR8 mice(C) were similar to those in the BALB/c mice, demonstrating that CCR8 humanized does not change the overall development, differentiation or distribution of these cell types in blood. Values are expressed as mean ± SEM.
-
Analysis of T cell subpopulation in blood
-
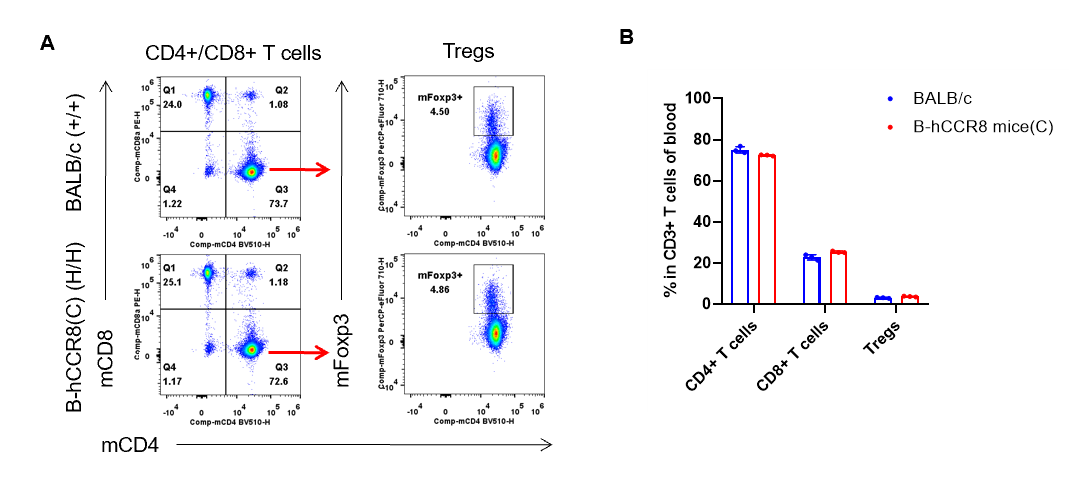
Analysis of blood T cell subpopulations by flow cytometry. Blood were isolated from female BALB/c and B-hCCR8 mice(C) (n=3, 7-week-old). Flow cytometry analysis of the leukocytes was performed to assess leukocyte subpopulations. A. Representative FACS plots. Single live CD45+ cells were gated for CD3+ T cell population and used for further analysis as indicated here. B. Results of FACS analysis. The percent of CD8+ T cells, CD4+ T cells, and Tregs in homozygous B-hCCR8 mice(C) were similar to those in the BALB/c mice, demonstrating that introduction of hCCR8 in place of its mouse counterpart does not change the overall development, differentiation or distribution of these T cell subtypes in blood. Values are expressed as mean ± SEM.
-
Analysis of leukocytes cell subpopulation in lymph nodes
-
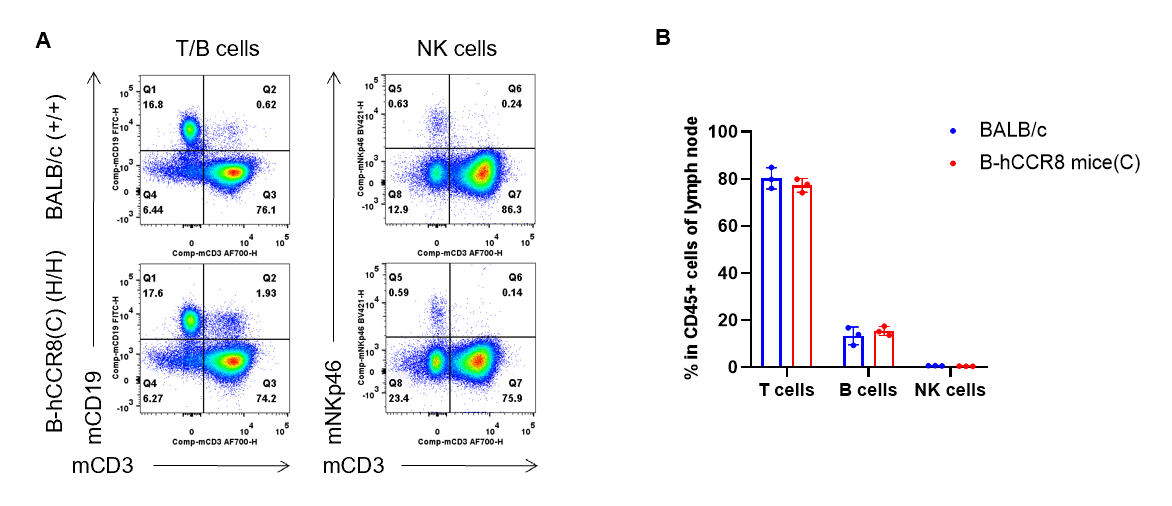
Analysis of lymph node leukocyte subpopulations by flow cytometry. Lymph nodes were isolated from female BALB/c and B-hCCR8 mice(C) (n=3, 7-week-old). Flow cytometry analysis of the leukocytes was performed to assess leukocyte subpopulations. A. Representative FACS plots. Single live cells were gated for CD45+ population and used for further analysis as indicated here. B. Results of FACS analysis. The percent of T cells, B cells and NK cells in homozygous B-hCCR8 mice(C) were similar to those in the BALB/c mice, demonstrating that introduction of hCCR8 in place of its mouse counterpart does not change the overall development, differentiation or distribution of these cell types in lymph node. Values are expressed as mean ± SEM.
-
Analysis of T cell subpopulation in lymph nodes
-
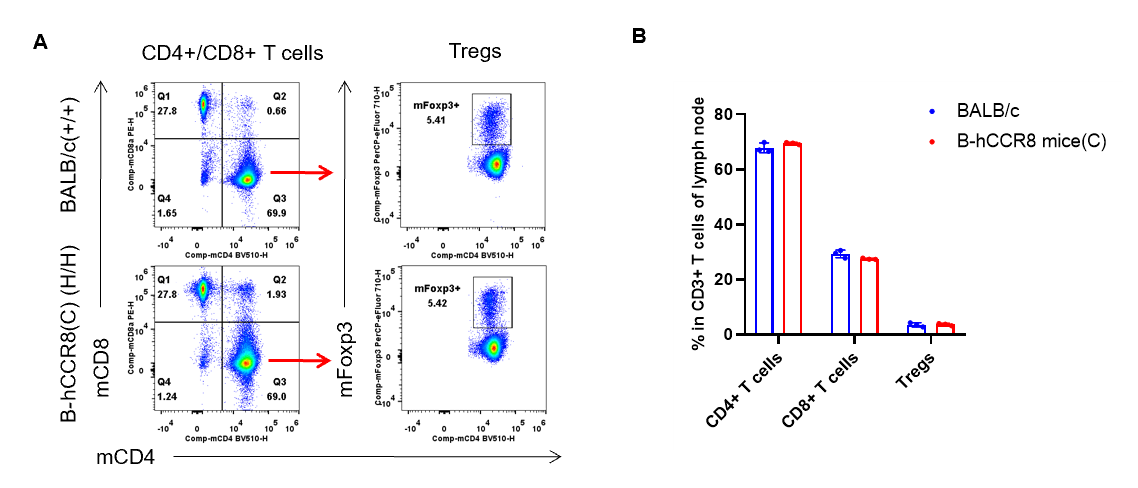
Analysis of lymph node T cell subpopulations by flow cytometry. Lymph nodes were isolated from female BALB/c and B-hCCR8 mice(C) (n=3, 7-week-old). Flow cytometry analysis of the leukocytes was performed to assess leukocyte subpopulations. A. Representative FACS plots. Single live CD45+ cells were gated for CD3+ T cell population and used for further analysis as indicated here. B. Results of FACS analysis. The percent of CD8+ T cells, CD4+ T cells, and Tregs in homozygous B-hCCR8 mice(C) mice were similar to those in the BALB/c mice, demonstrating that introduction of hCCR8 in place of its mouse counterpart does not change the overall development, differentiation or distribution of these T cell subtypes in lymph node. Values are expressed as mean ± SEM.
