
Basic Information
-
Targeting strategy

-
Gene targeting strategy for B-hCD16A mice(C). The regulatory region and exons 1~5 of mouse Fcgr4 gene that encodes the full-length protein were replaced by human FCGR3A exon 1~ intron 3 genome sequence plus exons 4~6 CDS carrying F158V mutation and regulatory region in B-hCD16A mice(C).
-
Protein expression analysis in blood and spleen-NK cells
-
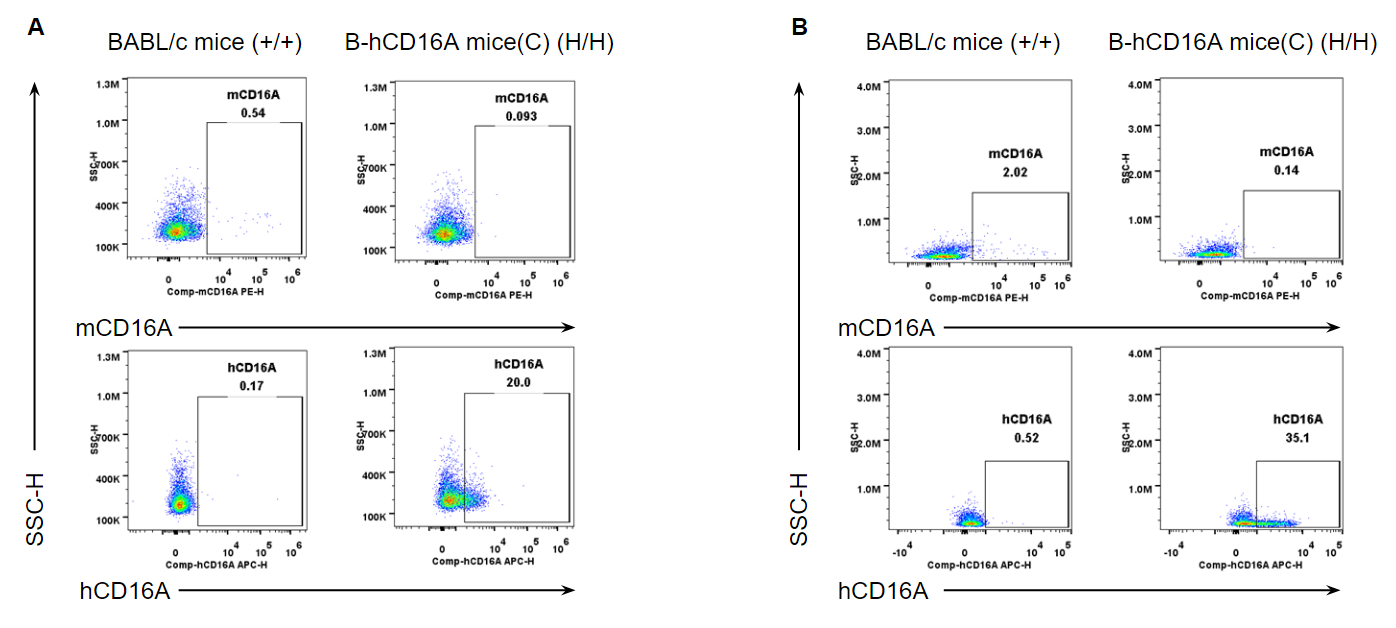
Strain specific CD16A expression analysis in homozygous B-hCD16A mice(C) by flow cytometry. Blood and spleen were collected from wild-type mice (+/+) and homozygous B-hCD16A mice(C) (H/H), and analyzed by flow cytometry with species-specific anti-CD16A antibody. Mouse CD16A was not detectable in wild-type mice. Human CD16A was only detectable in homozygous B-hCD16A mice(C) blood(A) and spleen(B).
-
Protein expression analysis in blood and spleen-Monocytes
-
Strain specific CD16A expression analysis in homozygous B-hCD16A mice(C) by flow cytometry. Blood and spleen were collected from wild-type mice (+/+) and homozygous B-hCD16A mice(C) (H/H), and analyzed by flow cytometry with species-specific anti-CD16A antibody. Mouse CD16A was not detectable in wild-type mice. Human CD16A was only detectable in homozygous B-hCD16A mice(C) blood(A) and spleen(B).
-
Protein expression analysis in blood and spleen-Macrophages
-
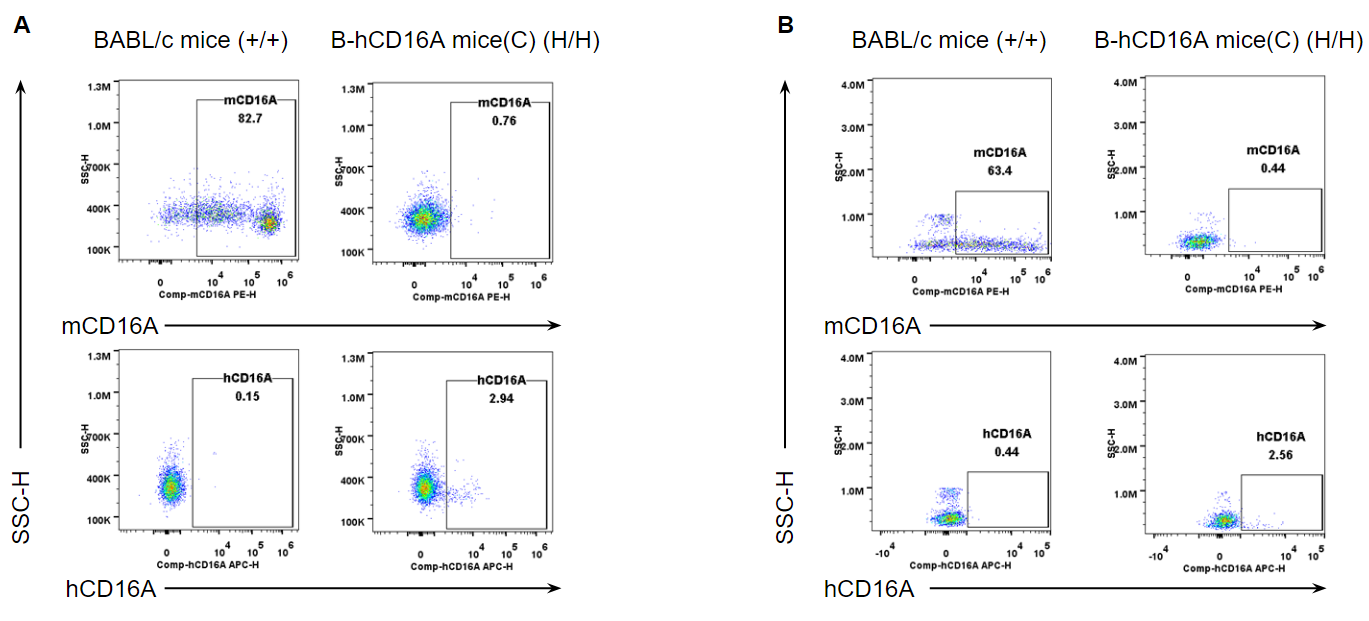
Strain specific CD16A expression analysis in homozygous B-hCD16A mice(C) by flow cytometry. Blood and spleen were collected from wild-type mice (+/+) and homozygous B-hCD16A mice(C) (H/H), and analyzed by flow cytometry with species-specific anti-CD16A antibody. Mouse CD16A was detectable in wild-type mice. Human CD16A was weakly detectable in homozygous B-hCD16A mice(C) blood(A) and spleen(B).
-
Protein expression analysis in blood and spleen-PEMs
-
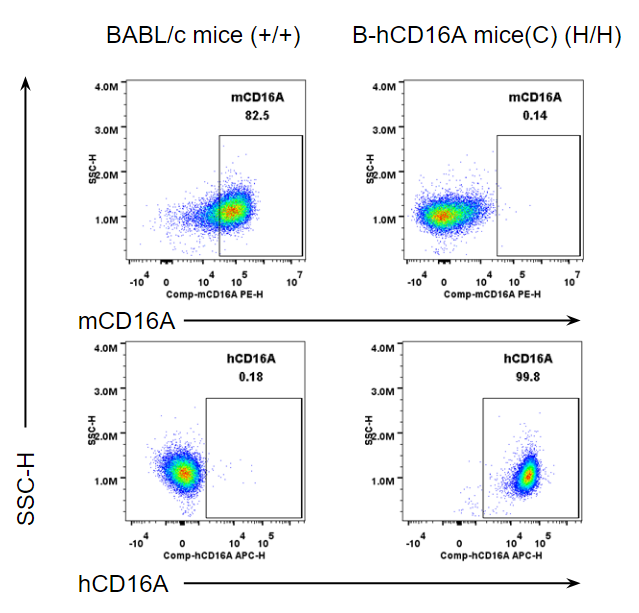
Strain specific CD16A expression analysis in homozygous B-hCD16A mice(C) by flow cytometry. Peritoneal exudative macrophages(PEMs) were collected from wild-type mice (+/+) and homozygous B-hCD16A mice(C) (H/H), and analyzed by flow cytometry with species-specific anti-CD16A antibody. Mouse CD16A was detectable in wild-type mice. Human CD16A was only detectable in homozygous B-hCD16A mice(C).
-
Analysis of T cell subpopulation in lymph node
-
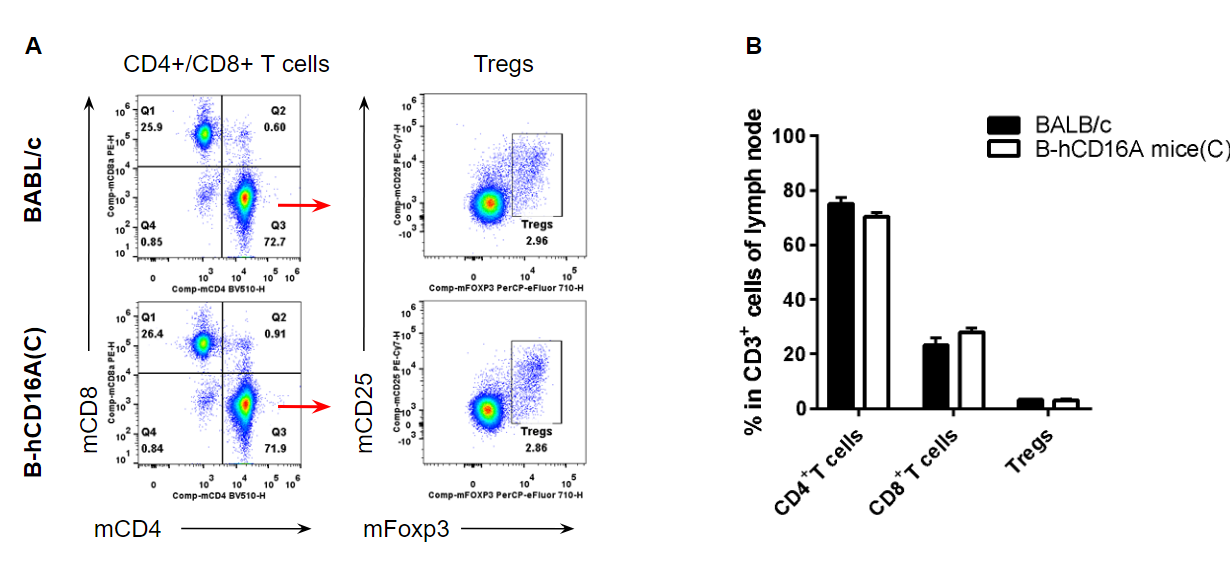
Analysis of LNs T cell subpopulations by FACS. LNs were isolated from female BABL/c and B-hCD16A mice(C) (n=3, 7-week-old). Flow cytometry analysis of the LNs was performed to assess leukocyte subpopulations. A. Representative FACS plots. Single live CD45+ cells were gated for CD3+T cell population and used for further analysis as indicated here. B. Results of FACS analysis. Values are expressed as mean ± SEM.
-
Analysis of leukocytes cell subpopulation in blood
-
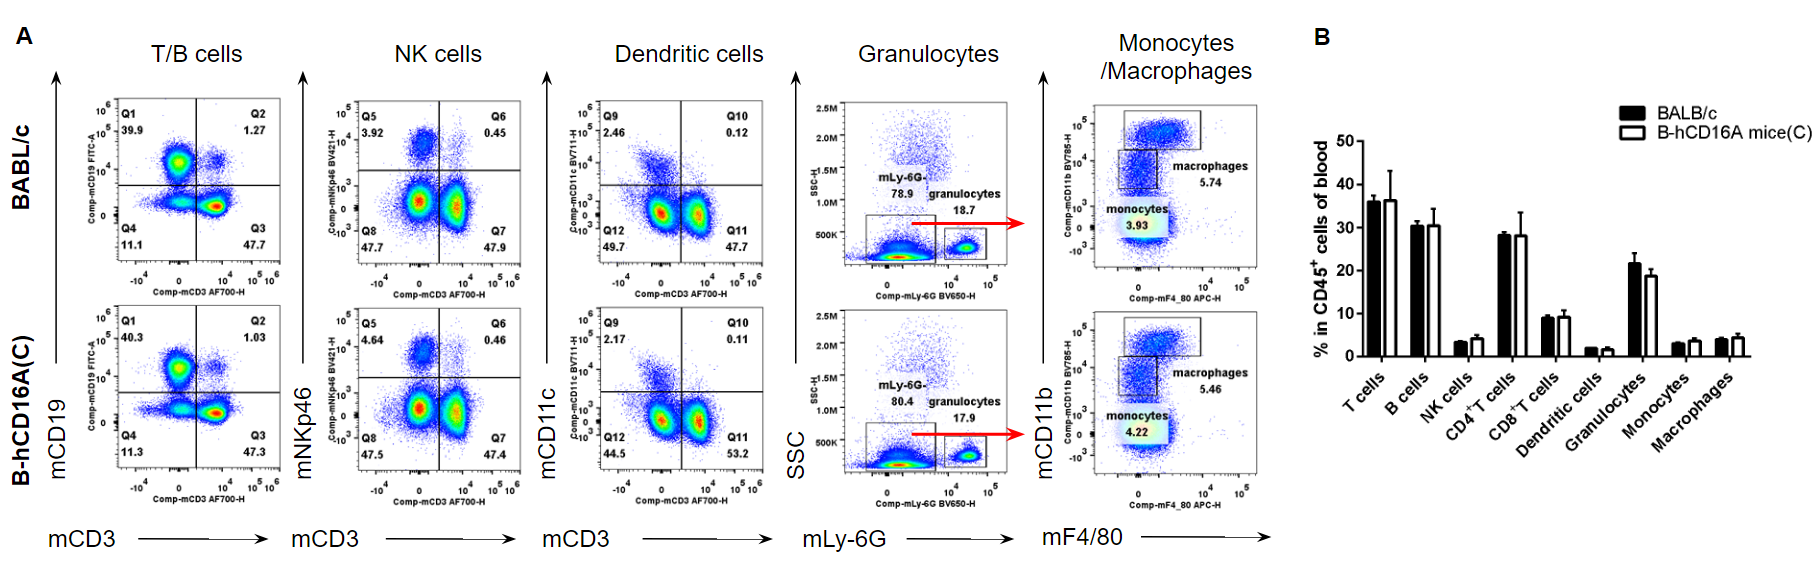
Analysis of blood leukocyte subpopulations by FACS. Blood were isolated from female BABL/c and B-hCD16A mice(C) (n=3, 7-week-old). Flow cytometry analysis of the blood was performed to assess leukocyte subpopulations. A. Representative FACS plots. Single live cells were gated for the CD45+ population and used for further analysis as indicated here. B. Results of FACS analysis. Values are expressed as mean ± SEM.
-
Analysis of spleen leukocyte subpopulations
-
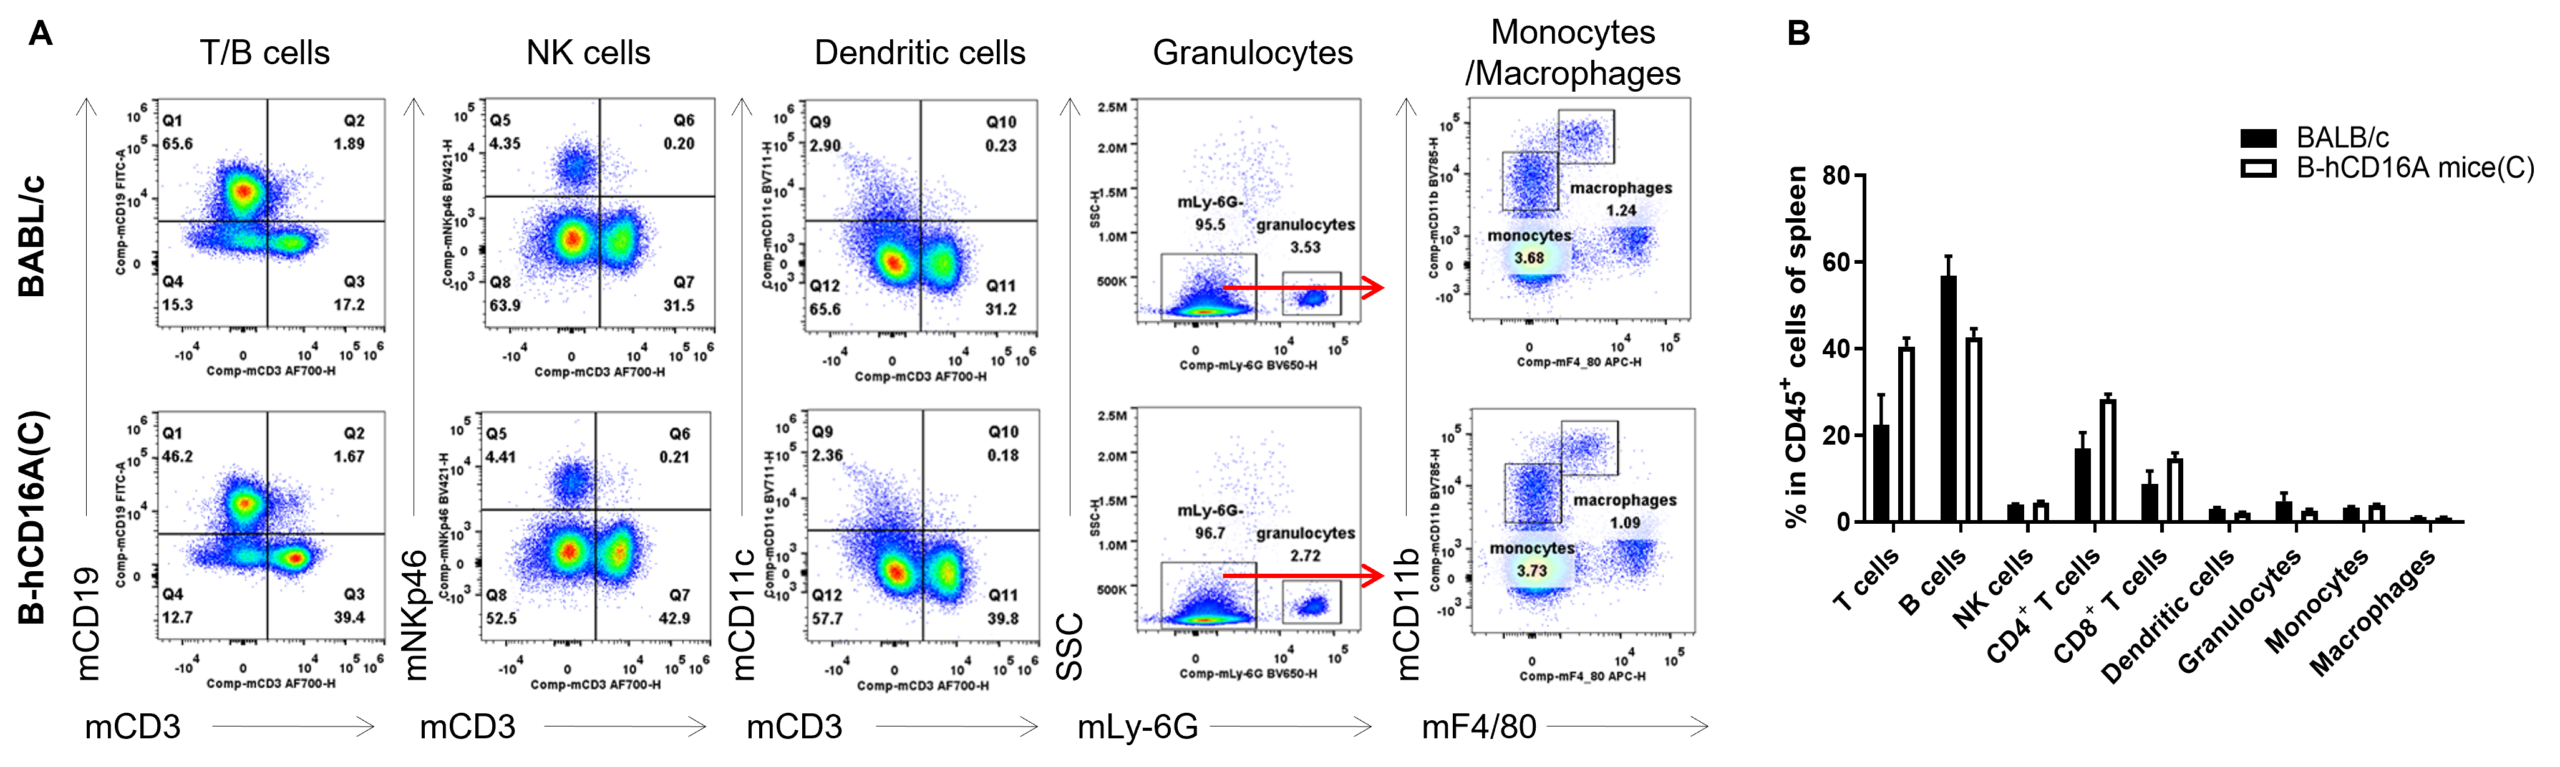
Analysis of spleen leukocyte subpopulations. Splenocytes were isolated from female BALB/c and B-hCD16A mice(C) (n=3, 7-week-old). Flow cytometry analysis of the splenocytes was performed to assess leukocyte subpopulations. A. Representative FACS plots. Single live cells were gated for the CD45+ population and used for further analysis as indicated here. B. Results of FACS analysis. Values are expressed as mean ± SEM.
-
Analysis of spleen T cell subpopulations
-
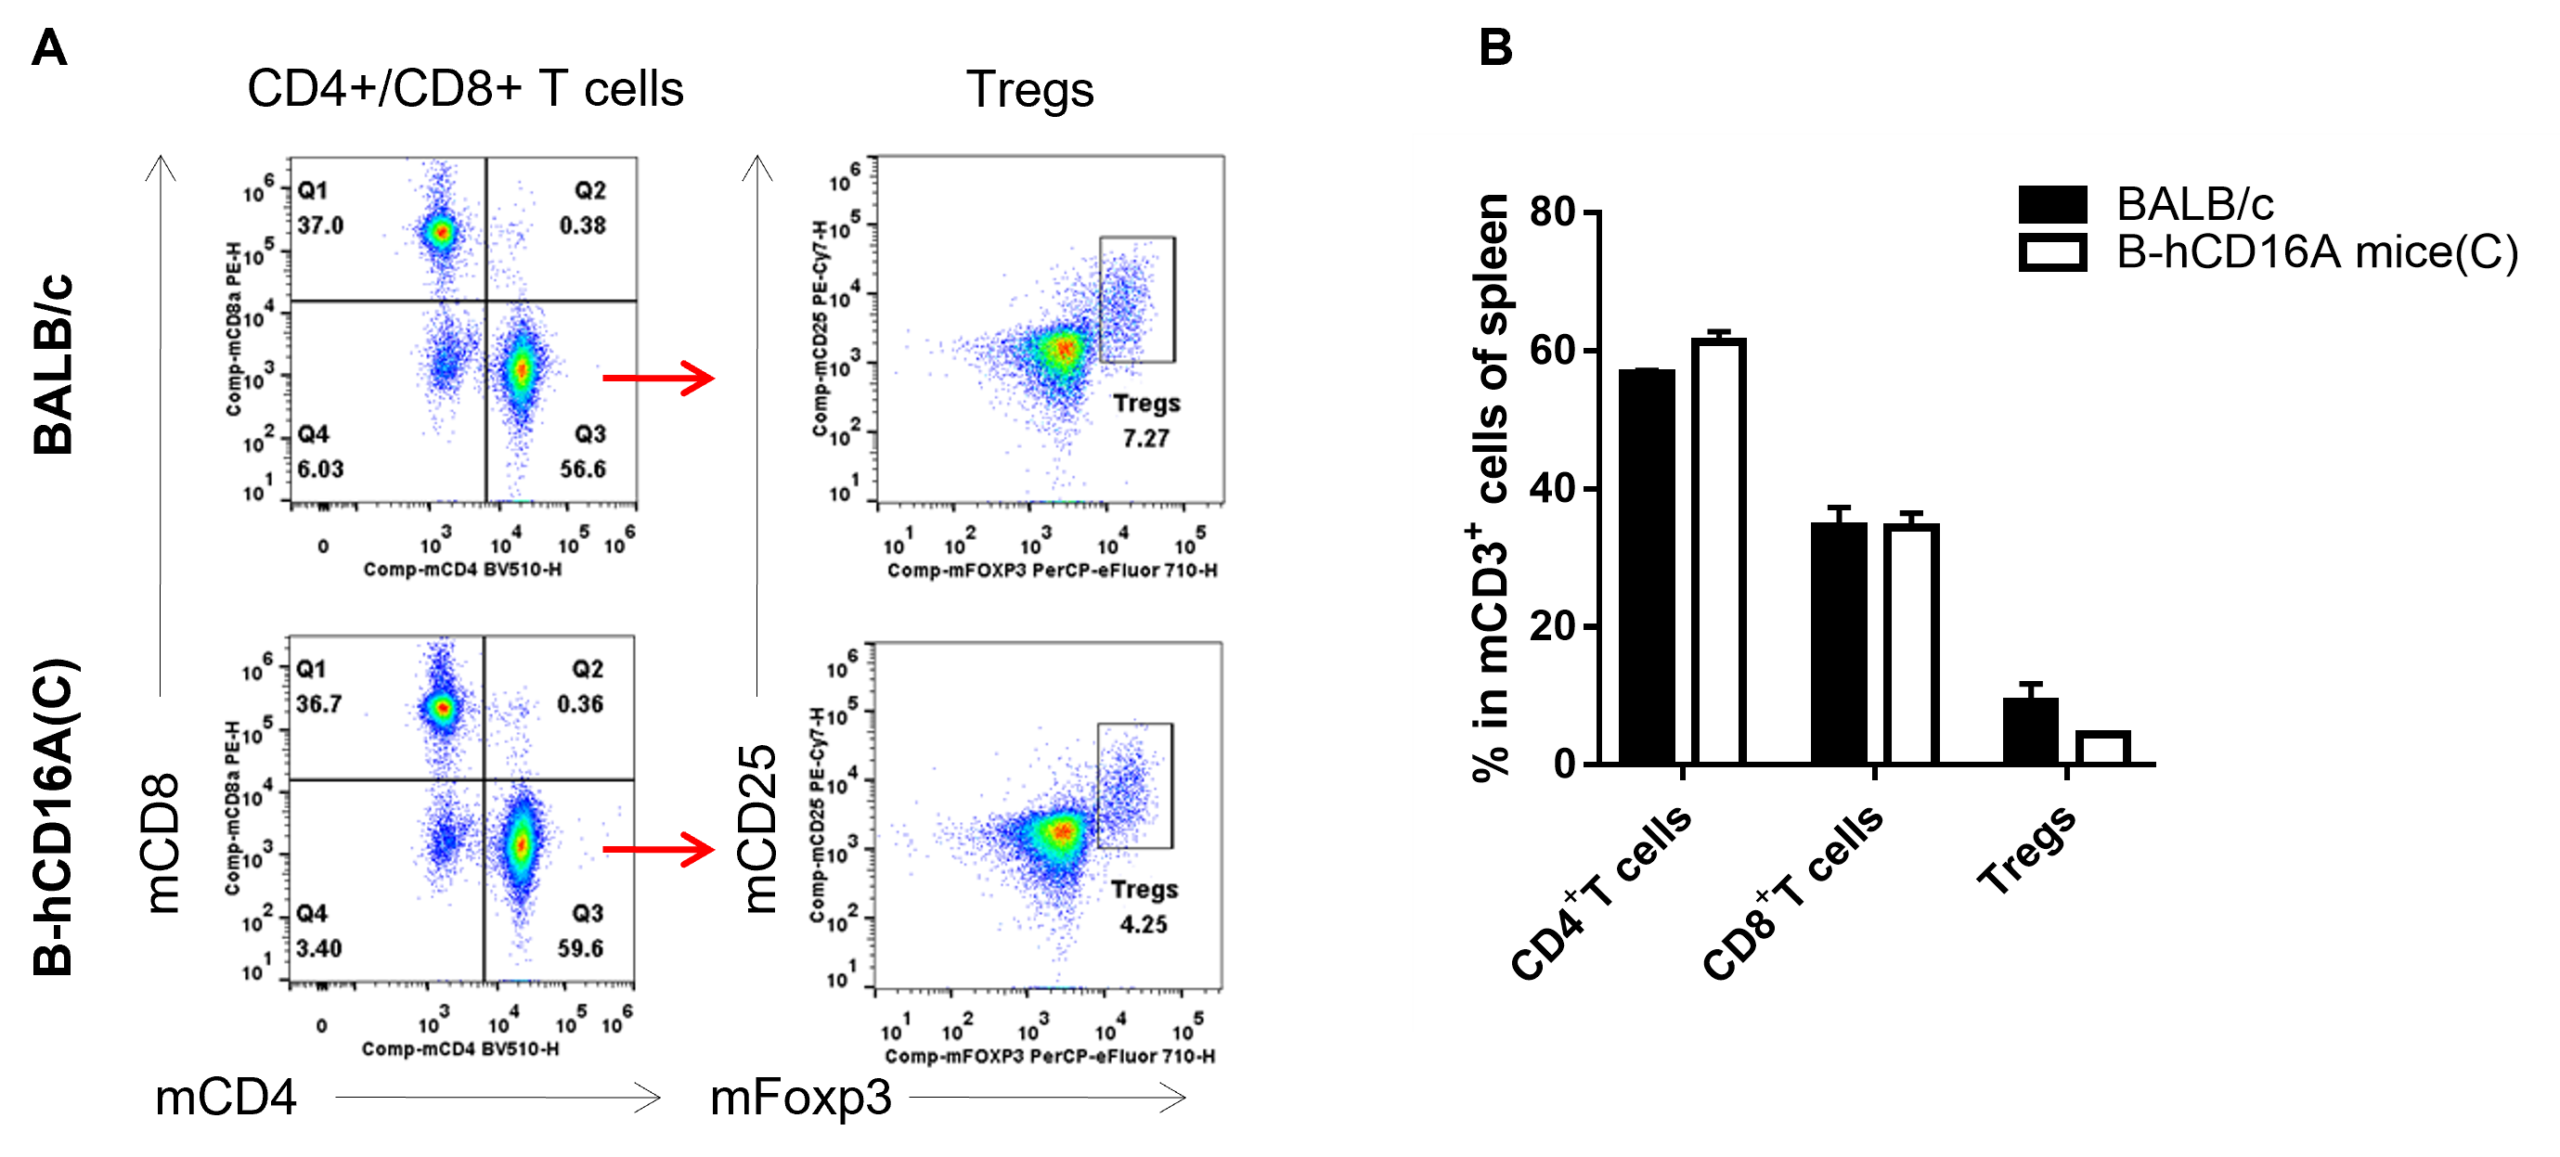
Analysis of spleen T cell subpopulations. Splenocytes were isolated from female BABL/c and B-hCD16A mice(C) (n=3, 7-week-old). Flow cytometry analysis of the splenocytes was performed to assess leukocyte subpopulations. A. Representative FACS plots. Single live CD45+ cells were gated for CD3+T cell population and used for further analysis as indicated here. B. Results of FACS analysis. Values are expressed as mean ± SEM.
-
Analysis of T cell subpopulation in blood
-
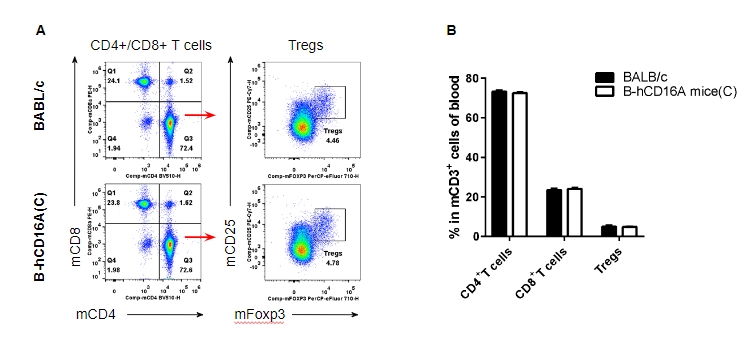
Analysis of blood T cell subpopulations by FACS. Blood were isolated from female BABL/c and B-hCD16A mice(C) (n=3, 7-week-old). Flow cytometry analysis of the blood was performed to assess leukocyte subpopulations. A. Representative FACS plots. Single live CD45+ cells were gated for CD3+T cell population and used for further analysis as indicated here. B. Results of FACS analysis. Values are expressed as mean ± SEM.
-
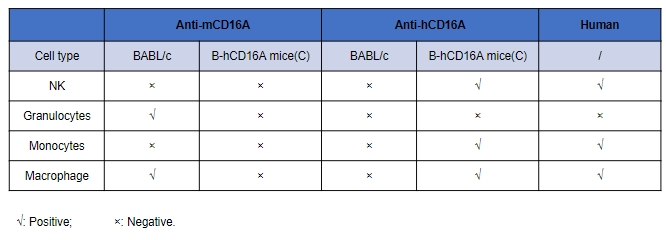
Summary of hCD16A expression in B-hCD16A mice(C)
-
-
Summary
-
- Protein expression analysis:
Human CD16A was detected in NK cells, monocytes and macrophages. We predicate that CD16A has similar expression pattern between human and B-hCD16A mice(C).
- Leukocytes cell subpopulation analysis:
Percentages of T, B, NK cells, monocyte/macrophages, and DC were similar in homozygous B-hCD16 mice(C) and wild-type mice, demonstrating that introduction of hCD16A in place of its mouse counterpart does not change the overall development, differentiation, or distribution of these cell types in spleen, lymph node leukocytes and blood.
