
Basic Information
-
Targeting strategy

-
Gene targeting strategy for B-hCD3E mice(C).
The exons 2-6 of mouse Cd3e gene that encode the extracellular domain were replaced by human CD3E exons 2-7 in B-hCD3E mice(C).
-
Protein expression analysis in spleen
-
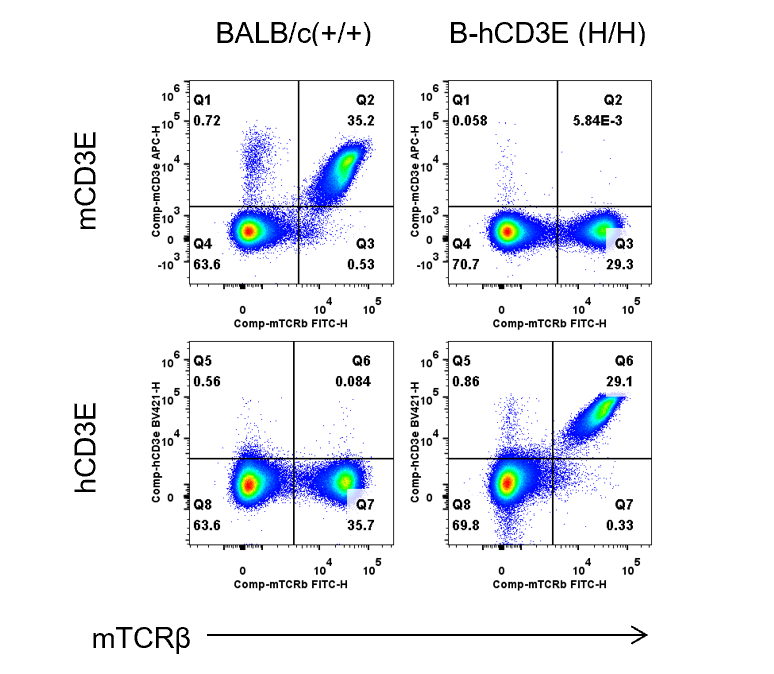
Strain specific CD3E expression analysis in wild-type BALB/c mice and homozygous humanized B-hCD3E mice(C) by flow cytometry.
Splenocytes were collected from wild-type BALB/c mice (+/+) and homozygous B-hCD3E mice(C) (H/H), and analyzed by flow cytometry. Mouse CD3E was only detectable in wild-type BALB/c mice. Human CD3E was exclusively detectable in homozygous B-hCD3E mice(C), but not in wild-type BALB/c mice.
-
Analysis of main immune organs
-

Spleen and thymus from BALB/c and B-hCD3E mice(C) (n=3) were weighed (A). Organ weight is shown as a ratio to body weight (B). Compared to BALB/c mice, there were not significantly different in spleen weight and the total number of splenocytes of B-hCD3E mice(C). The weight of thymus and the number of thymocytes in B-hCD3E mice(C) were lower than those in BALB/c mice. Data are represented as mean ±SEM.
-
Frequency of leukocyte subpopulations in thymus
-
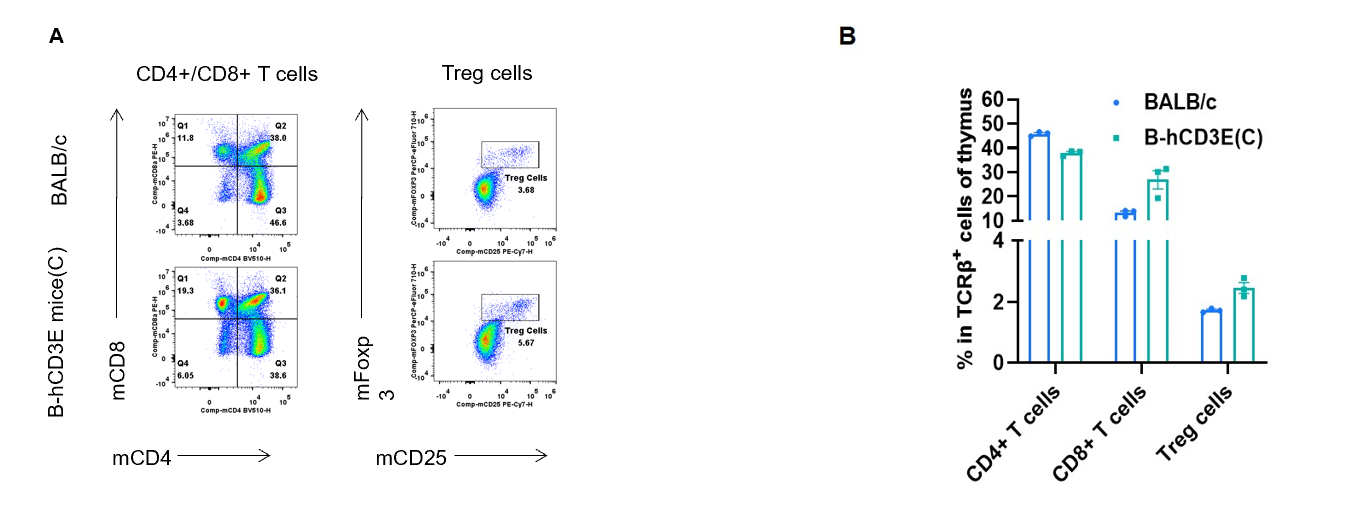
Analysis of thymus T cell subpopulations by FACS.
Thymocytes were isolated from wild-type BALB/c mice and homozygous B-hCD3E mice(C) (n=3, 7-week-old). A. Representative FACS plots. B. Frequency of T cell subpopulations. Percentage of Treg cells in homozygous B-hCD3E mice(C) is similar to that in BALB/c mice. Percent of CD4+ T cells, CD8+ T cells and Treg cells in homozygous B-hCD3E mice(C) were similar to those in the BALB/c mice, demonstrating that humanization of CD3E does not change the frequency or distribution of these cell types in thymus. Values are expressed as mean ± SEM.
-
Frequency of leukocyte subpopulations in spleen
-
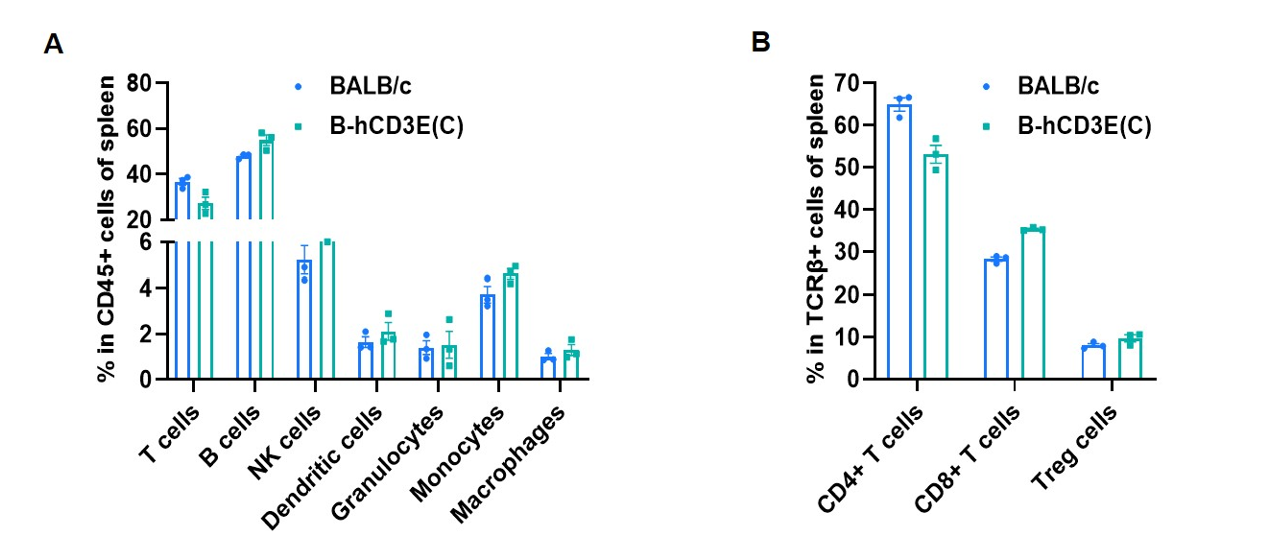
Frequency of leukocyte subpopulations in spleen by flow cytometry.
Splenocytes were isolated from wild-type BALB/c mice and homozygous B-hCD3E mice(C) (n=3, 7-week-old). A. Flow cytometry analysis of the splenocytes was performed to assess the frequency of leukocyte subpopulations. B. Frequency of T cell subpopulations. Percent of T cells, B cells, NK cells, dendritic cells, granulocytes, monocytes, macrophages, CD4+ T cells, CD8+ T cells and Treg cells in homozygous B-hCD3E mice(C) were similar to those in the BALB/c mice, demonstrating that humanization of CD3E does not change the frequency or distribution of these cell types in spleen. Values are expressed as mean ± SEM.
-
Frequency of leukocyte subpopulations in lymph node
-

Frequency of leukocyte subpopulations in lymph node by flow cytometry.
Leukocytes were isolated from wild-type BALB/c mice and homozygous B-hCD3E mice(C) (n=3, 7-week-old). A. Flow cytometry analysis of the leukocytes was performed to assess the frequency of leukocyte subpopulations. B. Frequency of T cell subpopulations. Percent of T cells, B cells, NK cells, CD4+ T cells, CD8+ T cells and Treg cells in homozygous B-hCD3E mice(C) were similar to those in the BALB/c mice, demonstrating that humanization of CD3E does not change the frequency or distribution of these cell types in lymph node. Values are expressed as mean ± SEM.
-
Frequency of leukocyte subpopulations in blood
-
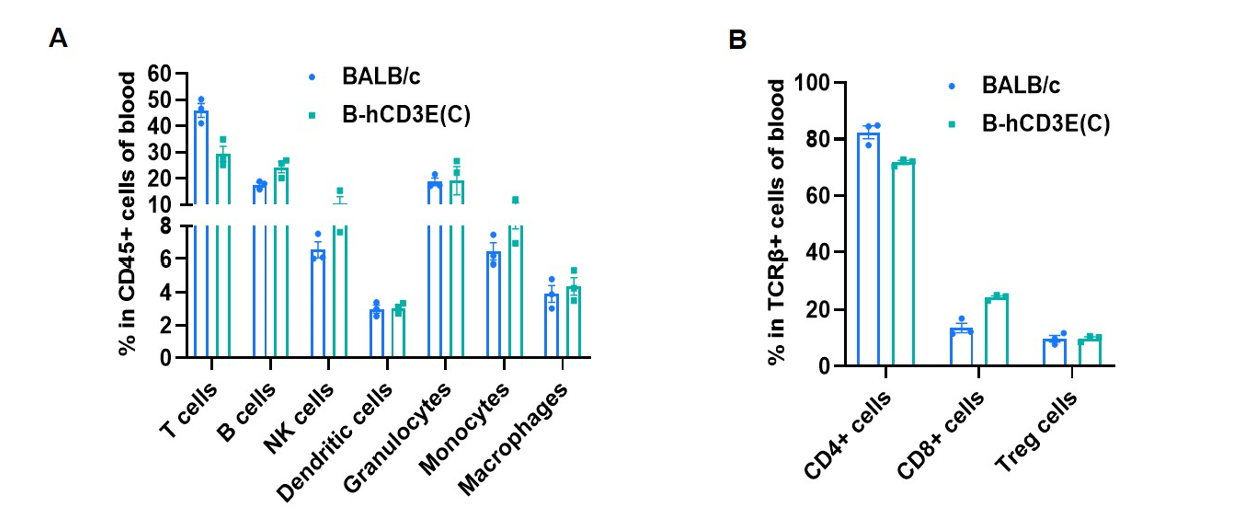
Frequency of leukocyte subpopulations in blood by flow cytometry.
Blood cells were isolated from wild-type BALB/c mice and homozygous B-hCD3E mice(C) (n=3, 7-week-old). A. Flow cytometry analysis of the blood cells was performed to assess the frequency of leukocyte subpopulations. B. Frequency of T cell subpopulations. Percent of T cells, B cells, NK cells, dendritic cells, granulocytes, monocytes, macrophages, CD4+ T cells, CD8+ T cells and Treg cells in homozygous B-hCD3E mice(C) were similar to those in the BALB/c mice, demonstrating that humanization of CD3E does not change the frequency or distribution of these cell types in blood. Values are expressed as mean ± SEM.
-
Analysis of T cell activation stimulated with anti-CD3ε antibody in vitro (flow cytometry)
-
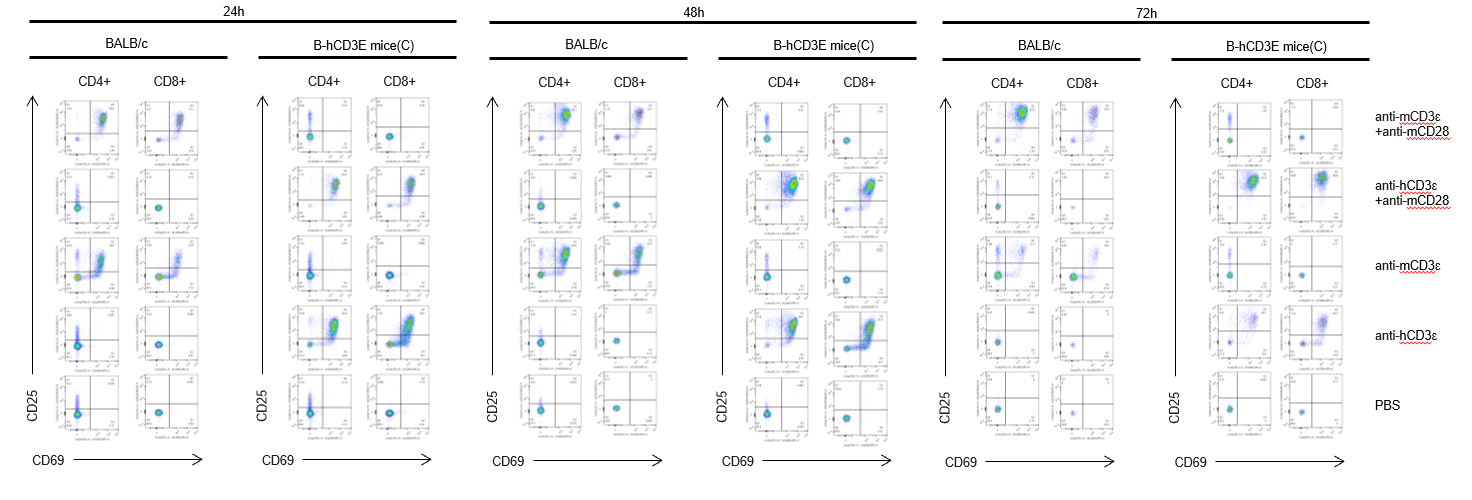
T cells (2×10⁵) were isolated from splenocytes of BALB/c and B-hCD3E mice(C) (n=3, 8 week-old), and were incubated in the presence of anti-CD3ε antibody (2ug/ml) and anti-mCD28 antibody (5ug/ml) for 24h, 48h and 72h. T cell activation was tested by flow cytometry. T cell activation in B-hCD3E mice(C) was significantly up-regulated by anti-hCD3ε antibody alone or in combination with anti-mCD28 antibody, similar to the activation level shown in BALB/c mice treated with anti-mCD3ε antibody alone or in combination with anti-mCD28 antibody.
-
Analysis of T cell activation stimulated with anti-CD3ε antibody in vitro (proliferation assay)
-
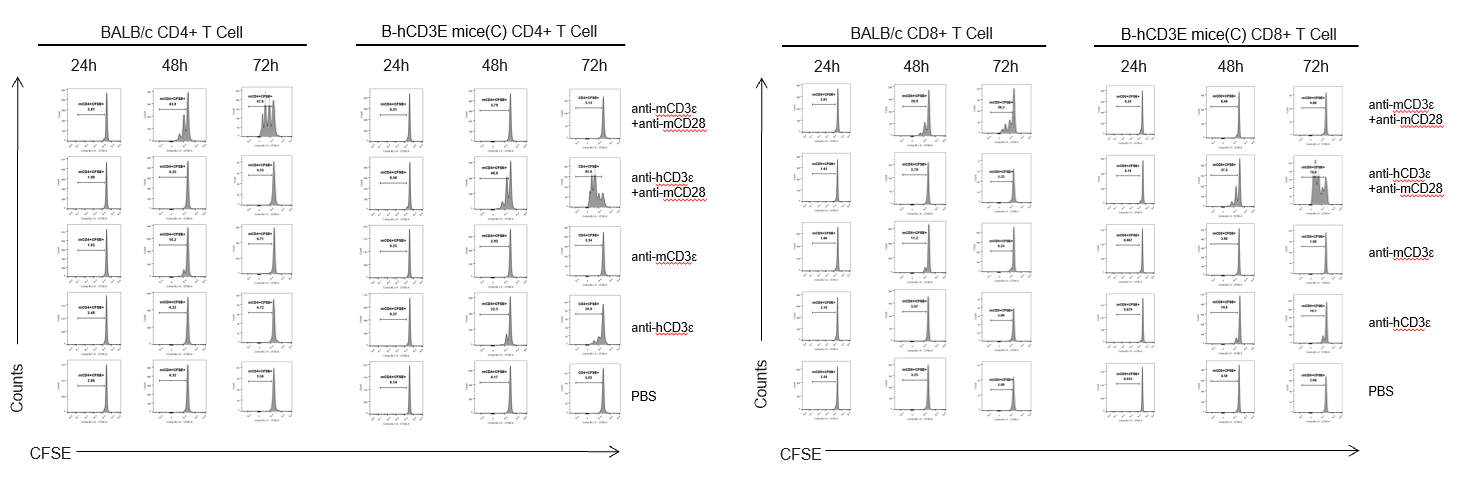
T cells (2×10⁵) were isolated from splenocytes of BALB/c and B-hCD3E mice(C) (n=3, 8 week-old), and were incubated in the presence of anti-CD3ε antibody (2ug/ml) and anti-mCD28 antibody (5ug/ml) for 24h, 48h and 72h. T cell proliferations was tested by flow cytometry. T cell activation in B-hCD3E mice(C) was significantly increased when treated with a combination of anti-hCD3ε antibody and anti-mCD28 antibody, similar to the level of activation observed in BALB/c mice treated a combination of anti-mCD3ε antibody and anti-mCD28 antibody.
-
Analysis of T cell activation stimulated with anti-CD3ε antibody in vitro (ELISA)
-

T cells (2×10⁵) were isolated from the splenocytes of BALB/c and B-hCD3E mice(C) (n=3, 8 week-old), incubated in the presence of anti-CD3ε antibody (2ug/ml) and anti-mCD28 antibody (5ug/ml) for 24h, 48h and 72h. IFN-γ and IL-2 production were then tested using ELISA. When stimulated with anti-hCD3 antibody and anti-mCD28 antibody in vitro, T cells from the spleen of B-hCD3E mice (C) showed a significant increase in production of IFN-γ and IL-2, similar to the data observed in BALB/c mice. ND: not detectable.
