
Basic Information
Description
Transgenic mice that express human HLA molecules represent a unique in vivo experimental model for evaluating human immune system function.These models have been used to study the role of the human class I or class Il restricted T cell repertoire in autoimmune disease, infectious disease, and vaccine development. They are also valued tools for evaluating human HLA restrictec T cell-mediated vaccine efficacy in oncology applications. Biocytogen developed the B-HLA 2.1 mice. The model B2m gene (Exon1 to Exon3) of mouse were replaced by the sequence encompassing the human B2M CDS and HLA-A*0201 gene that included leader sequence, α1 and α2 domains ligated to a fragment of the murine H2-D1 gene containing the α3, transmembrane and cytoplasmic domains. Mice expressing human HLA molecules have helped advance the understanding of human immune system function, as well as potential novel therapeutics.
-
Protein expression analysis

-
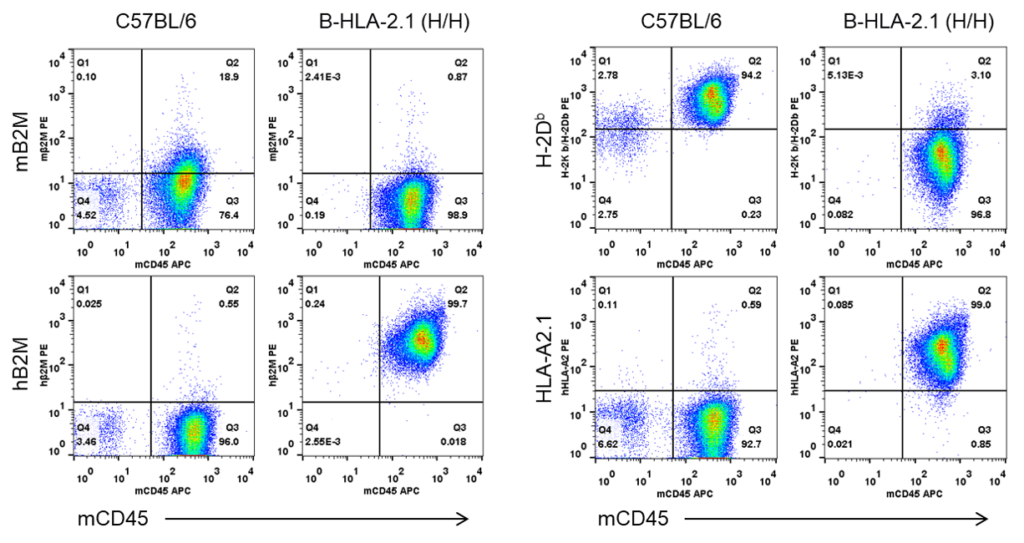
Strain specific B2M and HLA expression analysis in homozygous B-HLA-A2.1 mice by flow cytometry. Splenocytes from both wild-type C57BL/6 (+/+) and homozygous B-HLA-A2.1 mice (H/H) were analyzed by flow cytometry. Mouse B2M and H-2Kb/H-2Db were detectable in the wild-type C57BL/6 mice. Human B2M and HLA-A2.1 were only detectable in the homozygous B-HLA-A2.1 mice, while mouse B2M and H-2Kb/H-2Db were not detectable in the homozygous B-HLA-A2.1 mice.
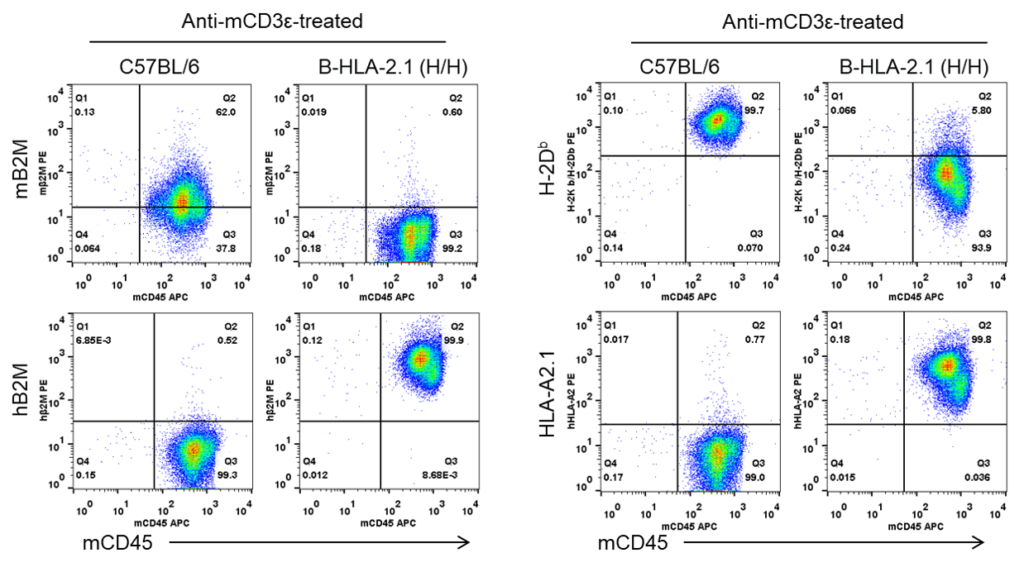
Strain specific B2M and HLA expression analysis in homozygous B-HLA-A2.1 mice by flow cytometry. Splenocytes from both wild-type C57BL/6 (+/+) and homozygous B-HLA-A2.1 mice (H/H) stimulated with anti-CD3ε in vivo, and analyzed by flow cytometry. Mouse B2M and H-2Kb/H-2Db were detectable in the wild-type C57BL/6 mice. Human B2M and HLA-A2.1 were only detectable in the homozygous B-HLA-A2.1 mice, while mouse B2M and H-2Kb/H-2Db were not detectable in the homozygous B-HLA-A2.1 mice.
-
Analysis of spleen leukocytes cell subpopulations in B-HLA-A2.1 mice
-
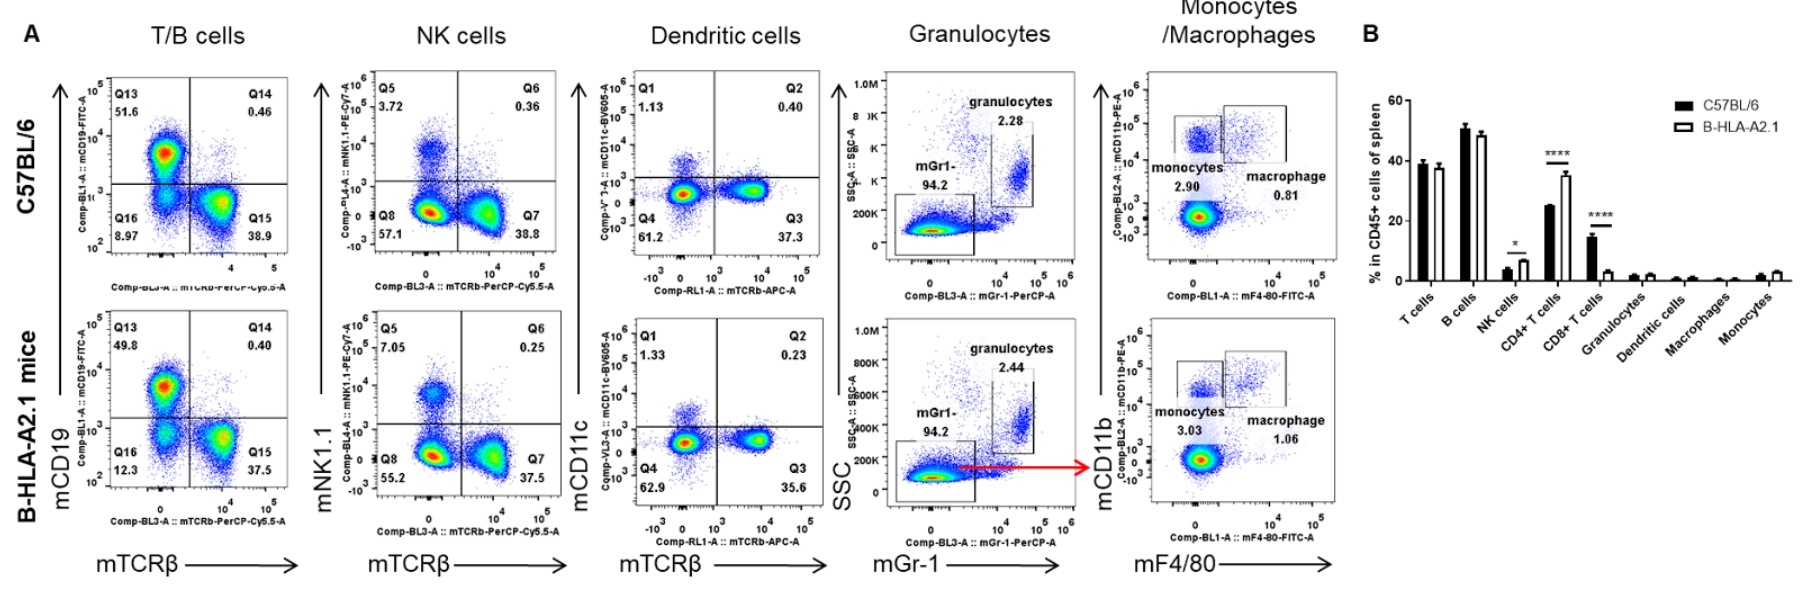
Analysis of spleen leukocyte subpopulations by FACS. Splenocytes were isolated from female C57BL/6 and B-HLA-A2.1 mice (n=3, 8-week-old). Flow cytometry analysis of the splenocytes was performed to assess leukocyte subpopulations. A. Representative FACS plots. Single live cells were gated for the CD45+ population and used for further analysis as indicated here. B. Results of FACS analysis. Percent of B cells, dendritic cells, granulocytes, monocytes and macrophages in homozygous B-HLA-A2.1 mice were similar to those in the C57BL/6 mice. Percent of CD8+ T cells were significantly decreased while percent of CD4+ T cells and NK cells were significantly increased, demonstrating that introduction of hB2M-HLA-A2.1-H-2D in place of mouse B2M may affected the development of CD8 + T cells, which in turn affected the proportion of T cell subtypes in the spleen. Values are expressed as mean ± SEM.
-
Analysis of T cell subpopulation in spleen
-
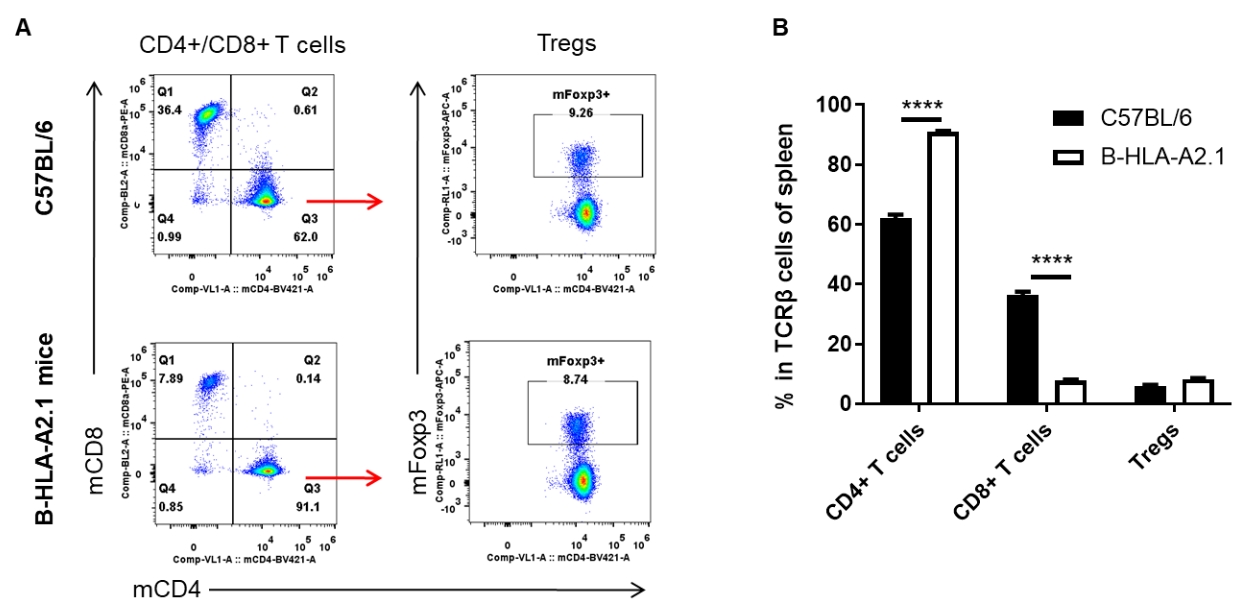
Analysis of spleen T cell subpopulations by FACS. Splenocytes were isolated from female C57BL/6 and B-HLA-A2.1 mice (n=3, 8-week-old). Flow cytometry analysis of the splenocytes was performed to assess leukocyte subpopulations. A. Representative FACS plots. Single live CD45+ cells were gated for TCRβ+ T cell population and used for further analysis as indicated here. B. Results of FACS analysis. The percent of Tregs in homozygous B-HLA-A2.1 mice were similar to those in the C57BL/6 mice. Percent of CD8+ T cells were significantly decreased while percent of CD4+ T cells were significantly increased, demonstrating that introduction of hB2M-HLA-A2.1-H-2D in place of mouse B2M may affected the development of CD8 + T cells, which in turn affected the proportion of T cell subtypes in the spleen. Values are expressed as mean ± SEM.
-
Analysis of leukocytes cell subpopulation in lymph node
-
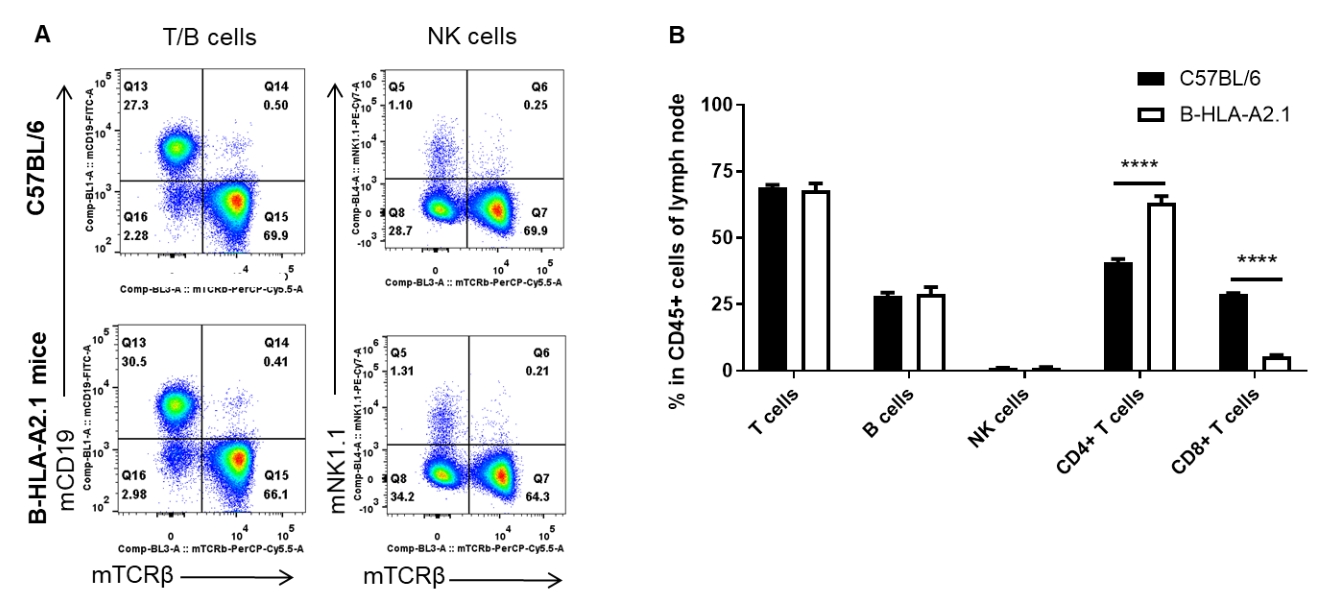
Analysis of lymph node leukocyte subpopulations by FACS. Lymph nodes were isolated from female C57BL/6 and B-HLA-A2.1 mice (n=3, 8-week-old). Flow cytometry analysis of the leukocytes was performed to assess leukocyte subpopulations. A. Representative FACS plots. Single live cells were gated for the CD45+ population and used for further analysis as indicated here. B. Results of FACS analysis. Percent of total T cells, B cells and NK cells in homozygous B-HLA-A2.1 mice were similar to those in the C57BL/6 mice. Percent of CD8+ T cells were significantly decreased while percent of CD4+ T cells were significantly increased, demonstrating that introduction of hB2M-HLA-A2.1-H-2D in place of mouse B2M may affected the development of CD8 + T cells, which in turn affected the proportion of T cell subtypes in lymph node. Values are expressed as mean ± SEM.
-
Analysis of T cell subpopulation in lymph node
-
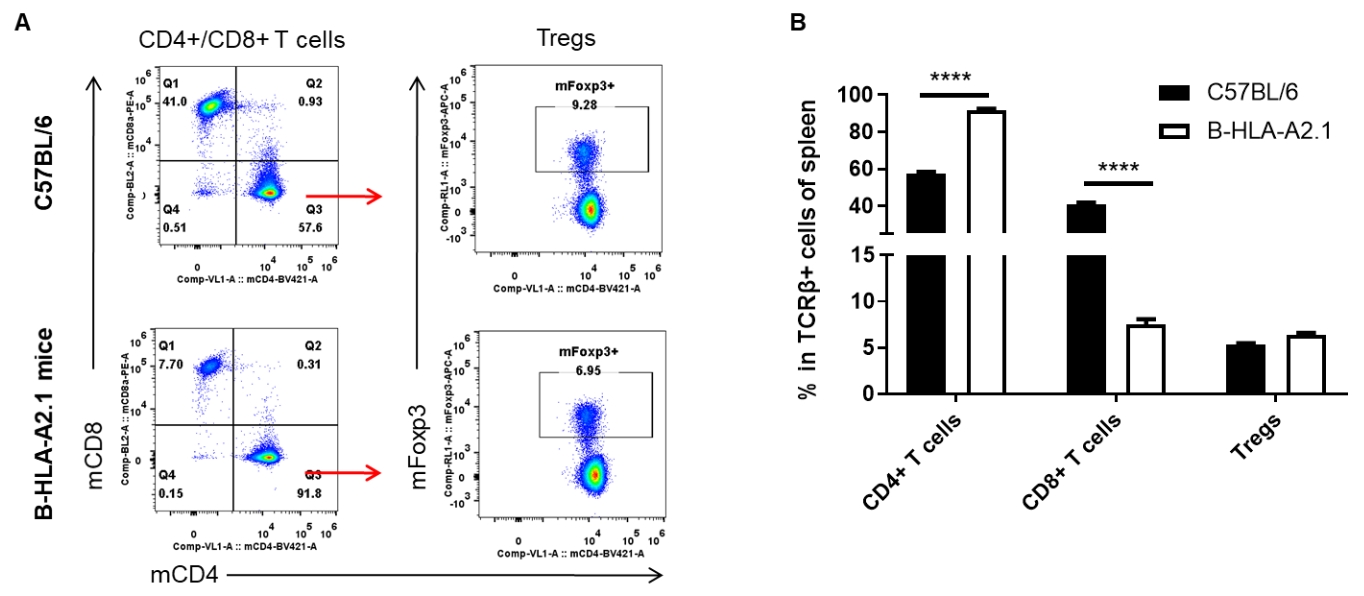
Analysis of lymph node T cell subpopulations by FACS. Leukocytes were isolated from lymph nodes of female C57BL/6 and B-HLA-A2.1 mice (n=3, 8-week-old). Flow cytometry analysis of the leukocytes was performed to assess leukocyte subpopulations. A. Representative FACS plots. Single live CD45+ cells were gated for TCRβ+ T cell population and used for further analysis as indicated here. B. Results of FACS analysis. The percent of Tregs in homozygous B-HLA-A2.1 mice were similar to those in the C57BL/6 mice. Percent of CD8+ T cells were significantly decreased while percent of CD4+ T cells were significantly increased, demonstrating that introduction of hB2M-HLA-A2.1-H-2D in place of mouse B2M may affected the development of CD8 + T cells, which in turn affected the proportion of T cell subtypes in lymph node. Values are expressed as mean ± SEM.
-
Analysis of leukocytes cell subpopulation in blood
-
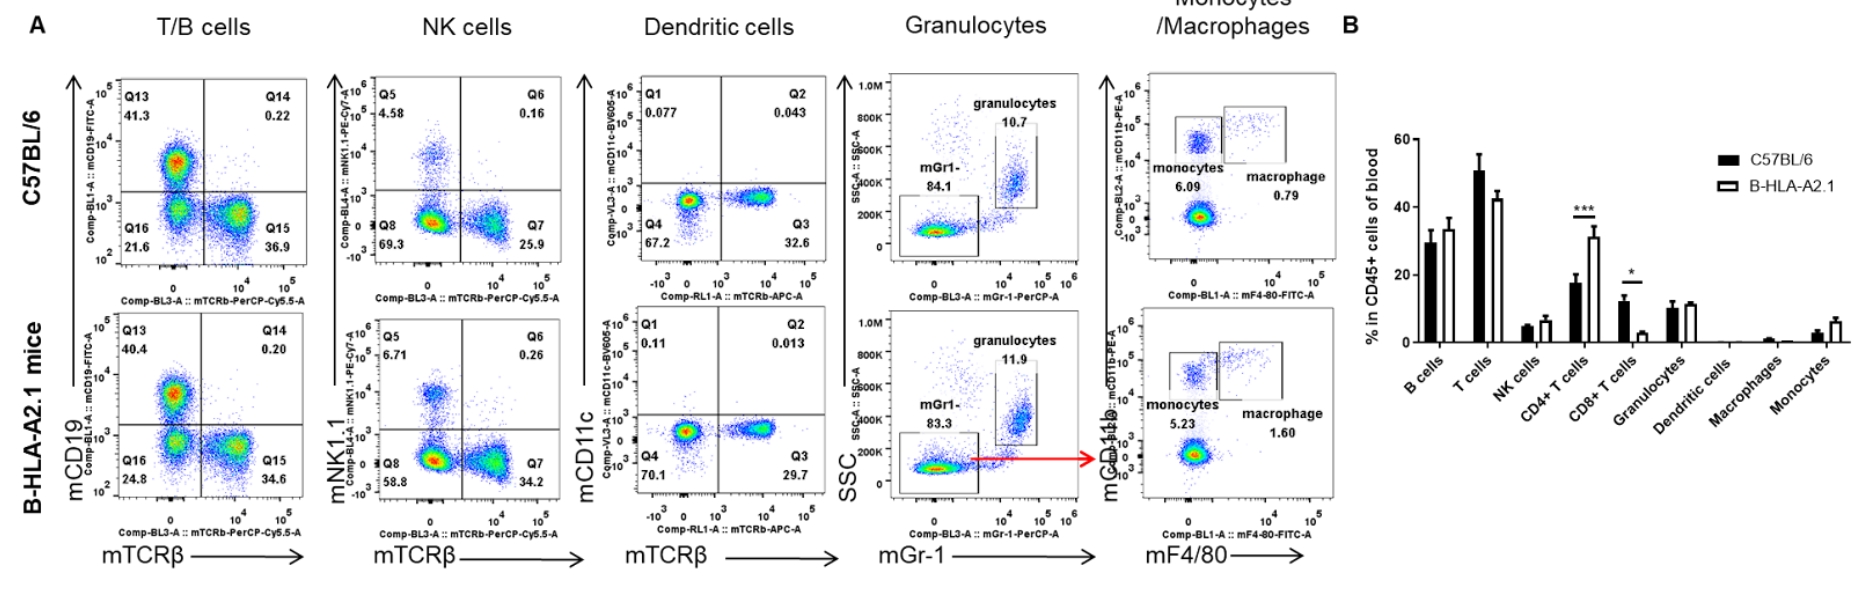
Analysis of blood leukocyte subpopulations by FACS. Blood cells were isolated from female C57BL/6 and B-HLA-A2.1 mice (n=3, 8-week-old). Flow cytometry analysis of the blood cells was performed to assess leukocyte subpopulations. A. Representative FACS plots. Single live cells were gated for the CD45+ population and used for further analysis as indicated here. B. Results of FACS analysis. Percent of total T cells, B cells, NK cells, dendritic cells, granulocytes, monocytes and macrophages in homozygous B-HLA-A2.1 mice were similar to those in the C57BL/6 mice. Percent of CD8+ T cells were significantly decreased while percent of CD4+ T cells were significantly increased, demonstrating that introduction of hB2M-HLA-A2.1-H-2D in place of mouse B2M may affected the development of CD8 + T cells, which in turn affected the proportion of T cell subtypes in blood. Values are expressed as mean ± SEM.
-
Analysis of T cell subpopulation in blood
-
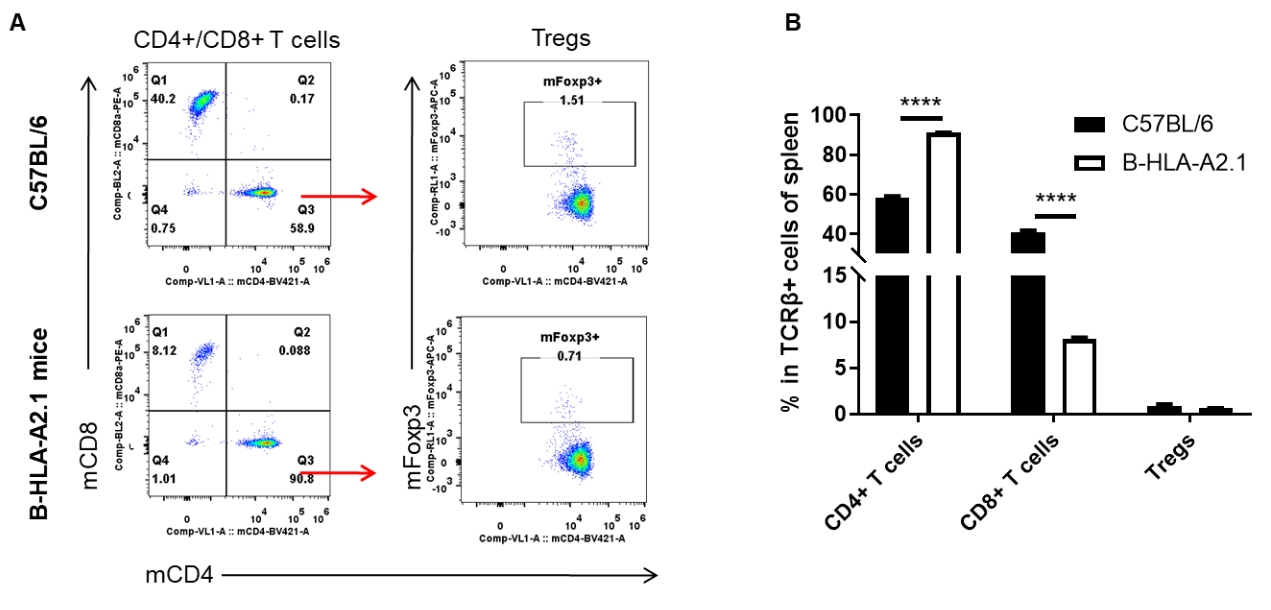
Analysis of blood T cell subpopulations by FACS. Blood cells were isolated from female C57BL/6 and B-HLA-A2.1 mice (n=3, 8-week-old). Flow cytometry analysis of the blood cells was performed to assess leukocyte subpopulations. A. Representative FACS plots. Single live CD45+ cells were gated for TCRβ+ T cell population and used for further analysis as indicated here. B. Results of FACS analysis. The percent of Tregs in homozygous B-HLA-A2.1 mice were similar to those in the C57BL/6 mice. Percent of CD8+ T cells were significantly decreased while percent of CD4+ T cells were significantly increased, demonstrating that introduction of hB2M-HLA-A2.1-H-2D in place of mouse B2M may affected the development of CD8 + T cells, which in turn affected the proportion of T cell subtypes in blood. Values are expressed as mean ± SEM.
-
Peptide vaccines induced immune responses in B-HLA-A2.1 mice
-
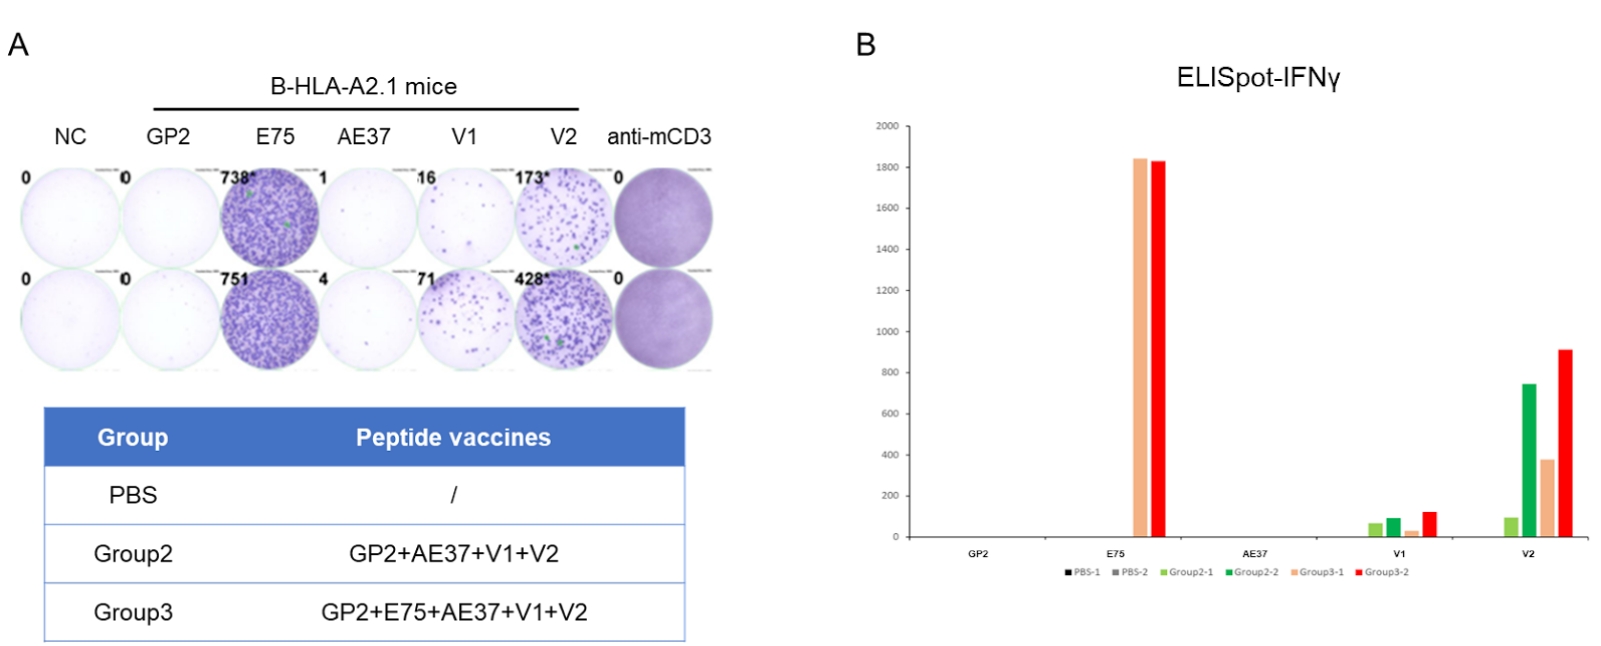
Detection of vaccine-induced immune responses in B-HLA-A2.1 mice by IFN-γ ELISpot assay. Female B-HLA-A2.1 mice at the age of 9–10 weeks were divided into PBS group, Group 2 and Group 3 (n = 2), and then inoculated PBS or vaccines at the inside muscle of both legs. Three weeks after the last immunization, mice were sacrificed. The splenocytes were extracted, stimulated with individual peptide or target-unrelated polypeptide as negative control (NC) or anti-CD3 as positive control, and then measured for IFN-γ secretion. No significant difference in body weight among groups (Data was not shown). (A) Representative results showing stimulation of splenocytes harvested from immunized mice with negative control, or peptide vaccines, or positive control in duplicates. (B) Summary of results. The results demonstrate that B-HLA-2.1 mice provide a powerful preclinical model for in vivo evaluation of vaccines. NC: negative control. V1: the first peptide vaccine to be evaluated.

Detection of vaccine-induced immune responses in B-HLA-A2.1 mice by IFN-γ ELISpot assay. Male B-HLA-A2.1 mice at the age of 9–10 weeks were divided into PBS group and NY-ESO-1 group (n = 3), and then inoculated PBS or vaccines at the inside muscle of both legs. One week after the last immunization, mice were sacrificed. The splenocytes were extracted, stimulated with individual peptide or target-unrelated polypeptide as negative control (NC) or anti-CD3 as positive control, and then measured for IFN-γ secretion. No significant difference in body weight among groups (Data was not shown). (A) Representative results showing stimulation of splenocytes harvested from immunized mice with negative control, or peptide vaccines, or positive control in duplicates. (B) Summary of results. The results demonstrate that B-HLA-2.1 mice provide a powerful preclinical model for in vivo evaluation of vaccines. NC: negative control. PC: positive control.
-
Antitumor effect of WT1-Db126 against B-HLA-A2.1/WT1 MC38 tumor cells
-

Antitumor activity of WT1-Db126 against syngeneic tumors. (A) Experimental scheme. (B) Antitumor activity of prophylactic treatment with WT1-Db126. B-HLA-A2.1 mice (n = 8/group) were vaccinated with WT1-Db126 (150 µg) or PBS. One week after the last immunization, B-HLA-A2.1/WT1 MC38 cells were inoculated into the right flank of the mice. (C) Body weight changes during treatment. As shown in panel A, WT1-Db126 peptides were efficacious in controlling tumor growth in B-HLA-A2.1 mice, demonstrating that the B-HLA-A2.1 mice provide a powerful preclinical model for in vivo evaluation of vaccines. Values are expressed as mean ± SEM. (D) B-HLA-A2.1/WT1 MC38 tumor cells growth of individual mice. (E) Representative results showing stimulation of splenocytes harvested from immunized mice with negative control, or peptide vaccines in duplicates. (F) Summary of results. These results demonstrate that B-HLA-2.1 mice provide a powerful preclinical model for in vivo evaluation of vaccines.
-
Publications using B-HLA-A2.1 mice
