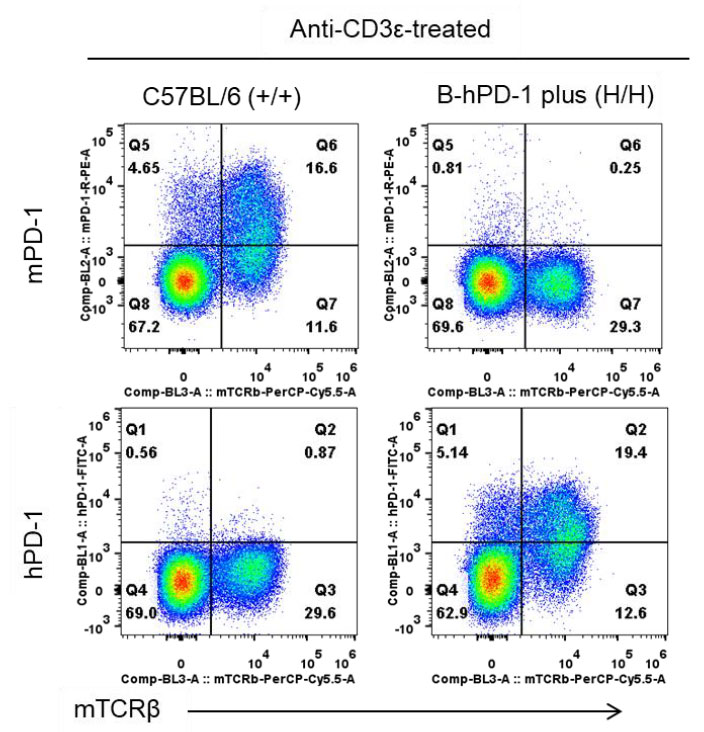
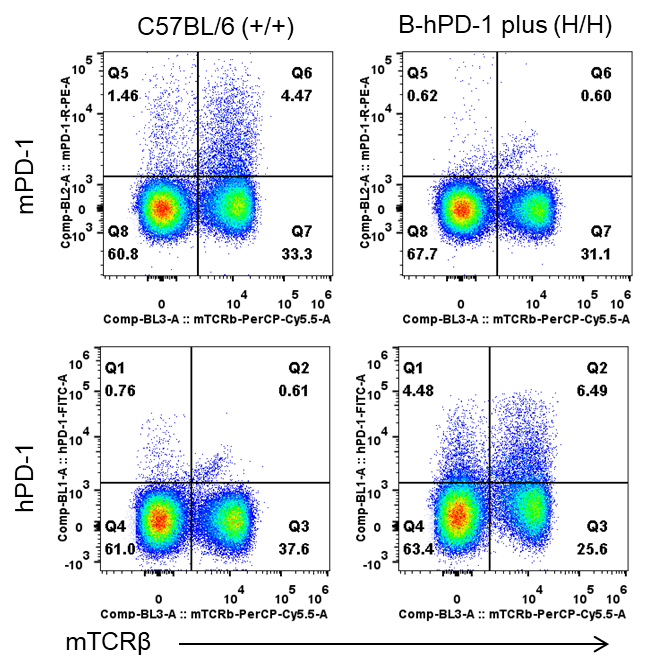
Q1. How is species-specific PD-1 expression validated in PD-1 humanized mice (B-hPD-1 mice plus)?
Validation data demonstrate that mouse PD-1 is detectable only in wild-type C57BL/6 mice, whereas human PD-1 is exclusively expressed in homozygous PD-1 humanized mice (B-hPD-1 mice plus). Flow cytometry confirms human PD-1 expression on T cells, including after in vivo anti-CD3ε stimulation, verifying correct species-specific replacement.
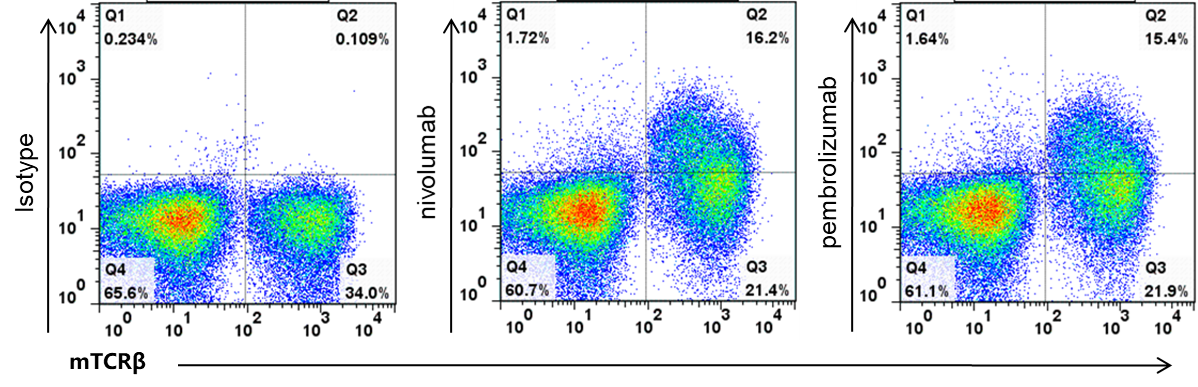
Q2. Can clinically relevant anti-human PD-1 antibodies bind to PD-1 humanized mice (B-hPD-1 mice plus)?
Yes. Human PD-1 expressed on T cells in PD-1 humanized mice (B-hPD-1 mice plus) is functionally accessible. Therapeutic antibodies such as nivolumab and pembrolizumab specifically bind human PD-1 in this model, demonstrating its suitability for evaluating anti-human PD-1 antibody pharmacodynamics and efficacy.
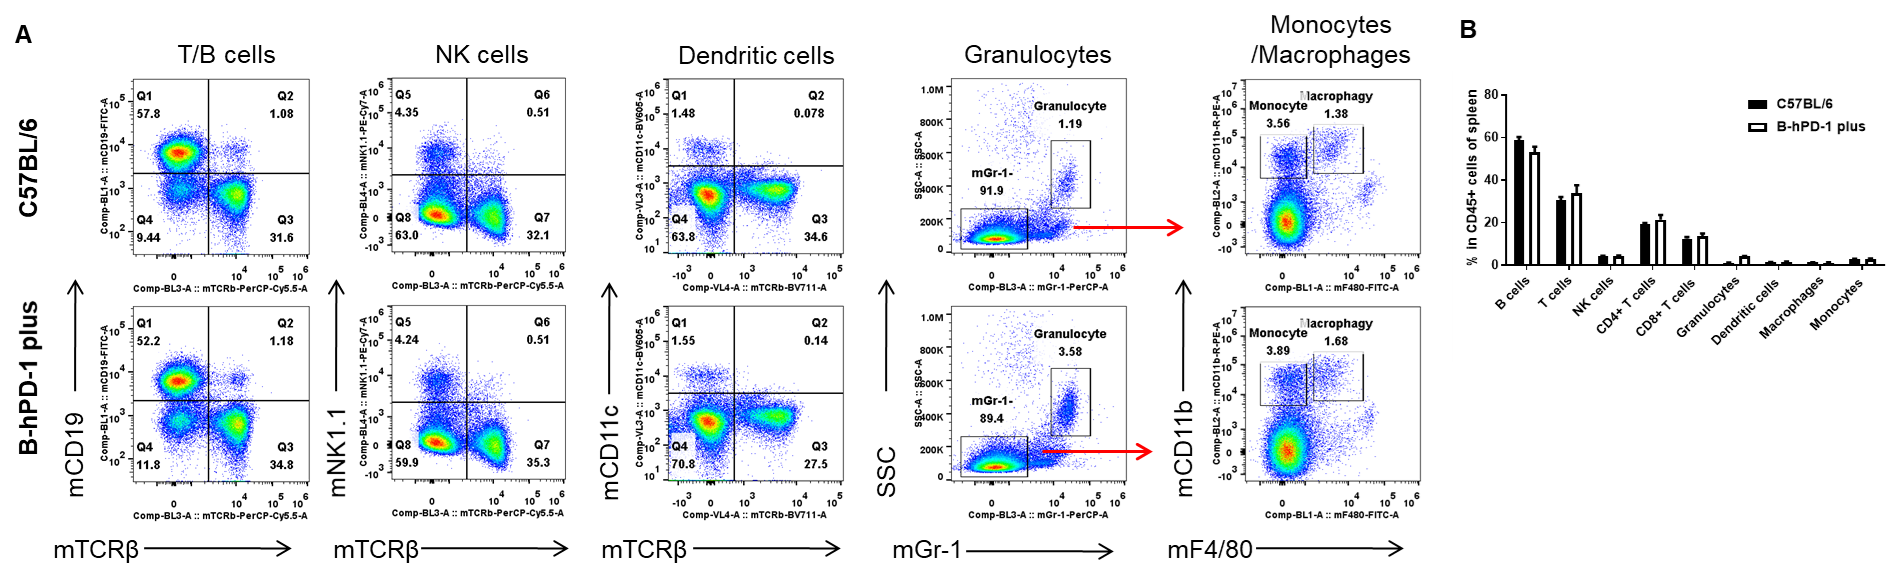
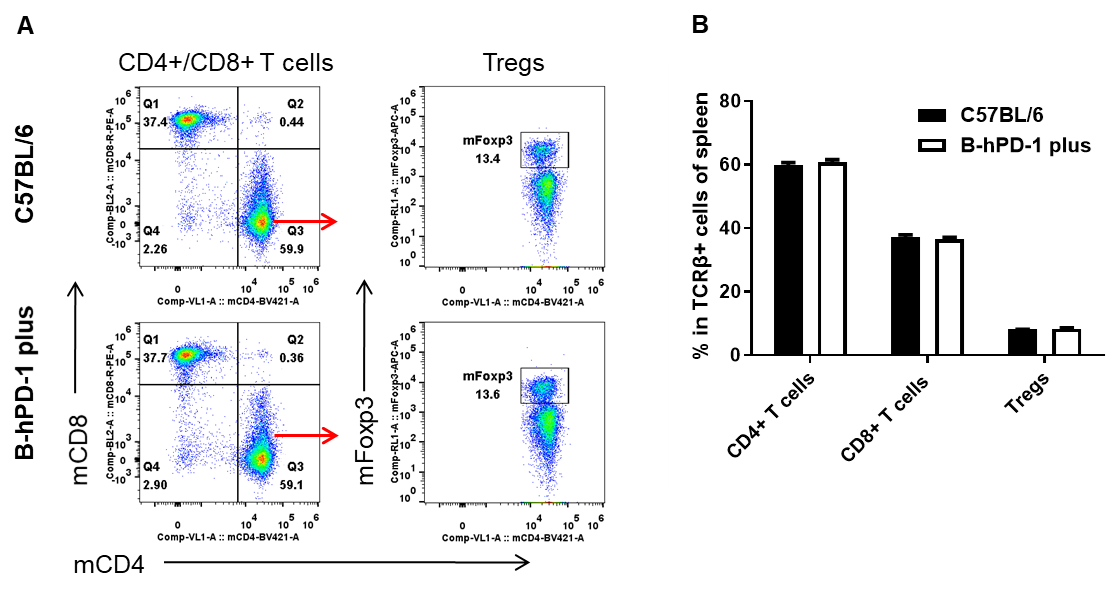
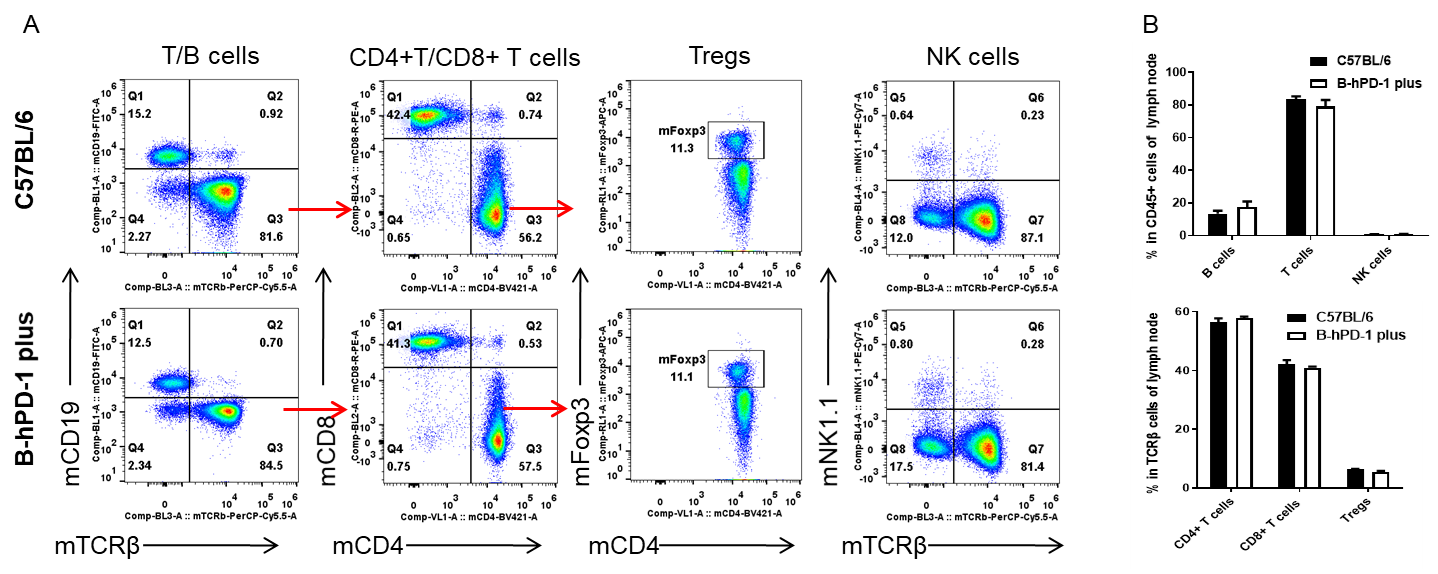
Q3. Does humanization of PD-1 alter immune cell development in PD-1 humanized mice (B-hPD-1 mice plus)?
Flow cytometry profiling indicates that major leukocyte populations in spleen and lymph nodes—including T cells, B cells, NK cells, dendritic cells, granulocytes, monocytes/macrophages—and T-cell subsets (CD4⁺, CD8⁺, and Tregs) are comparable between PD-1 humanized mice (B-hPD-1 mice plus) and wild-type controls, supporting preserved immune system integrity.
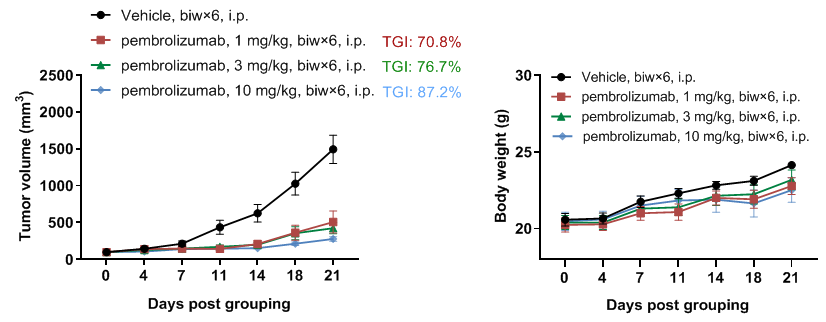
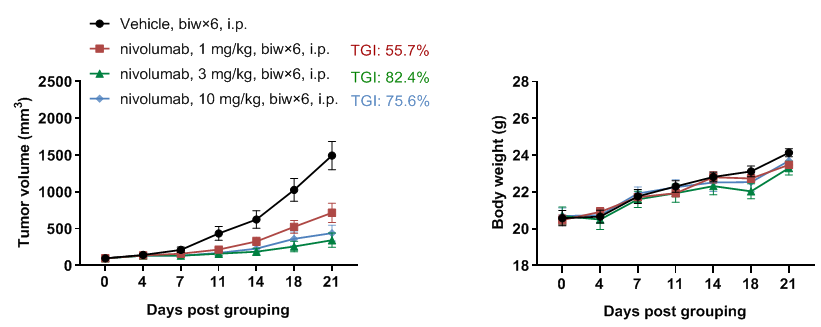
Q4. What are the primary applications of PD-1 humanized mice (B-hPD-1 mice plus)?
PD-1 humanized mice (B-hPD-1 mice plus) are designed for in vivo evaluation of anti-human PD-1 therapeutics. In syngeneic tumor models such as MC38, treatment with anti-human PD-1 antibodies significantly inhibits tumor growth, making this model ideal for efficacy, pharmacodynamic, and combination immunotherapy studies.