
Basic Information
-
Targeting strategy

-
Gene targeting strategy for B-hTFR1 mice.
The exons 4-19 of mouse Tfr1 gene that encode the extracellular region were replaced by human TFR1 exons 4-19 in B-hTFR1 mice.
-
mRNA expression analysis
-
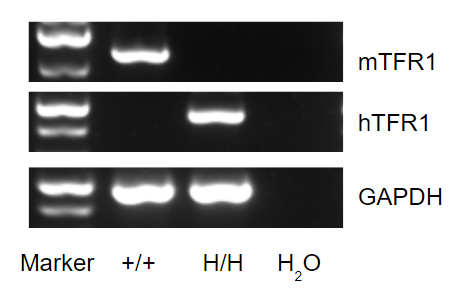
Strain specific analysis of TFR1 gene expression in wild type (WT) mice and B-hTFR1 mice by RT-PCR.
Mouse Tfrc mRNA was detectable only in splenocytes of WT mice (+/+). Human TFRC mRNA was detectable only in homozygous B-hTFR1 mice (H/H) but not in WT mice (+/+).
-
Protein expression analysis in erythroid cells
-
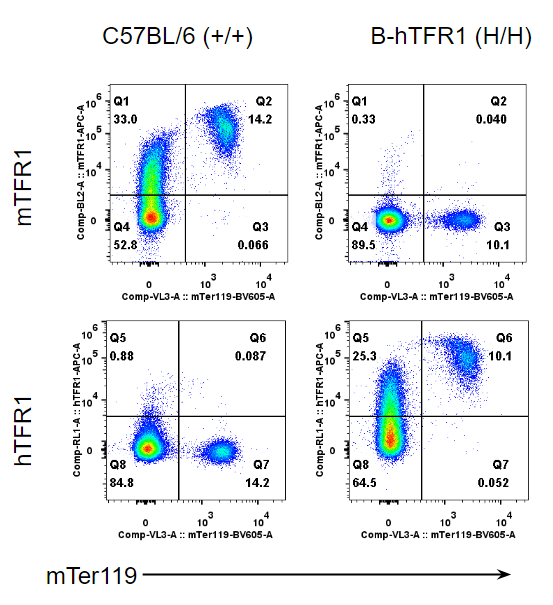
Strain specific TFR1 expression analysis in homozygous B-hTFR1 mice by flow cytometry.
Bone marrow was collected from wild type (WT) mice (+/+) and homozygous B-hTFR1 mice (H/H), and analyzed by flow cytometry with species-specific anti-TFR1 antibody. Mouse TFR1 was detectable in WT mice (+/+). Human TFR1 was exclusively detectable in homozygous B-hTFR1 mice (H/H) but not in WT mice (+/+).
-
Protein expression analysis in brain
-
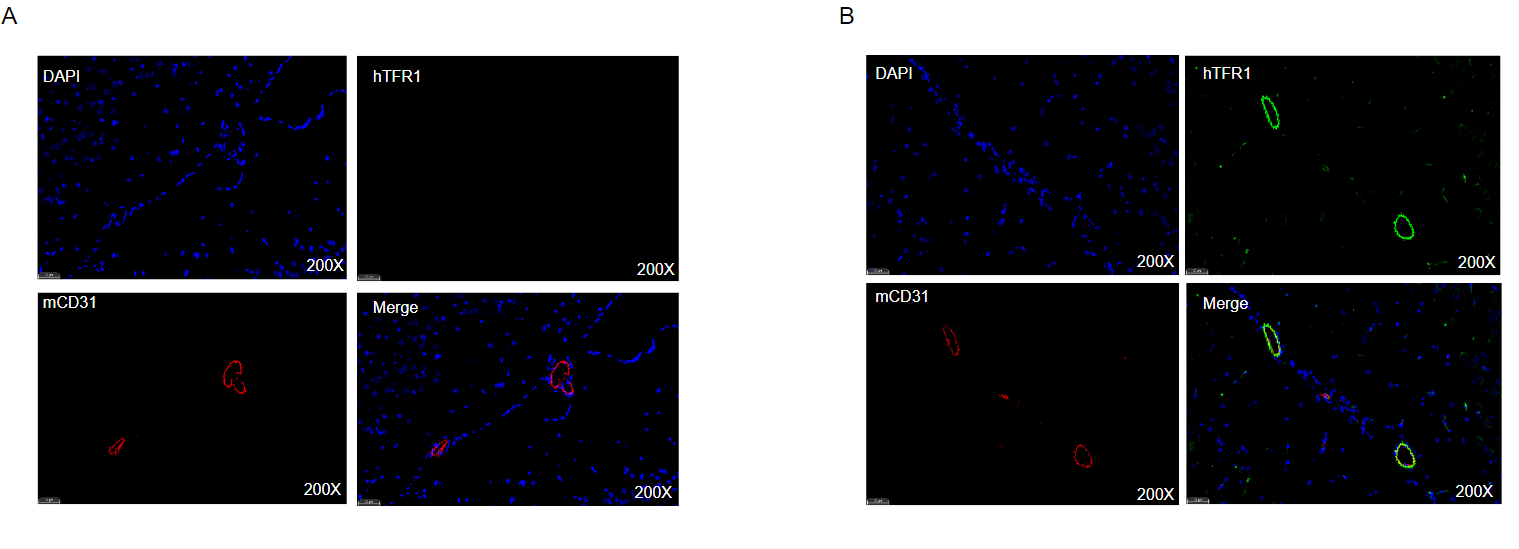
Strain specific TFR1 expression analysis in homozygous B-hTFR1 mice by Immunofluorescence staining.
Brain was collected from wild type (WT) mice and homozygous B-hTFR1 mice (female,8 week old) and processed into paraffin sections. The paraffin sections were stained using an species-specific anti-human TFR1 antibody (green). Brain tissues were co-stained with an anti-mouse CD31 antibody to visualize microvascular endothelial cells (red). Representative results of WT mice (A) and homozygous B-hTFR1 mice (B) are shown. The results indicated that human TFR1 was exclusively detectable on brain microvascular endothelium of homozygous B-hTFR1 mice, but not in WT mice.
-
Analysis of spleen leukocytes cell subpopulations in B-hTFR1 mice
-
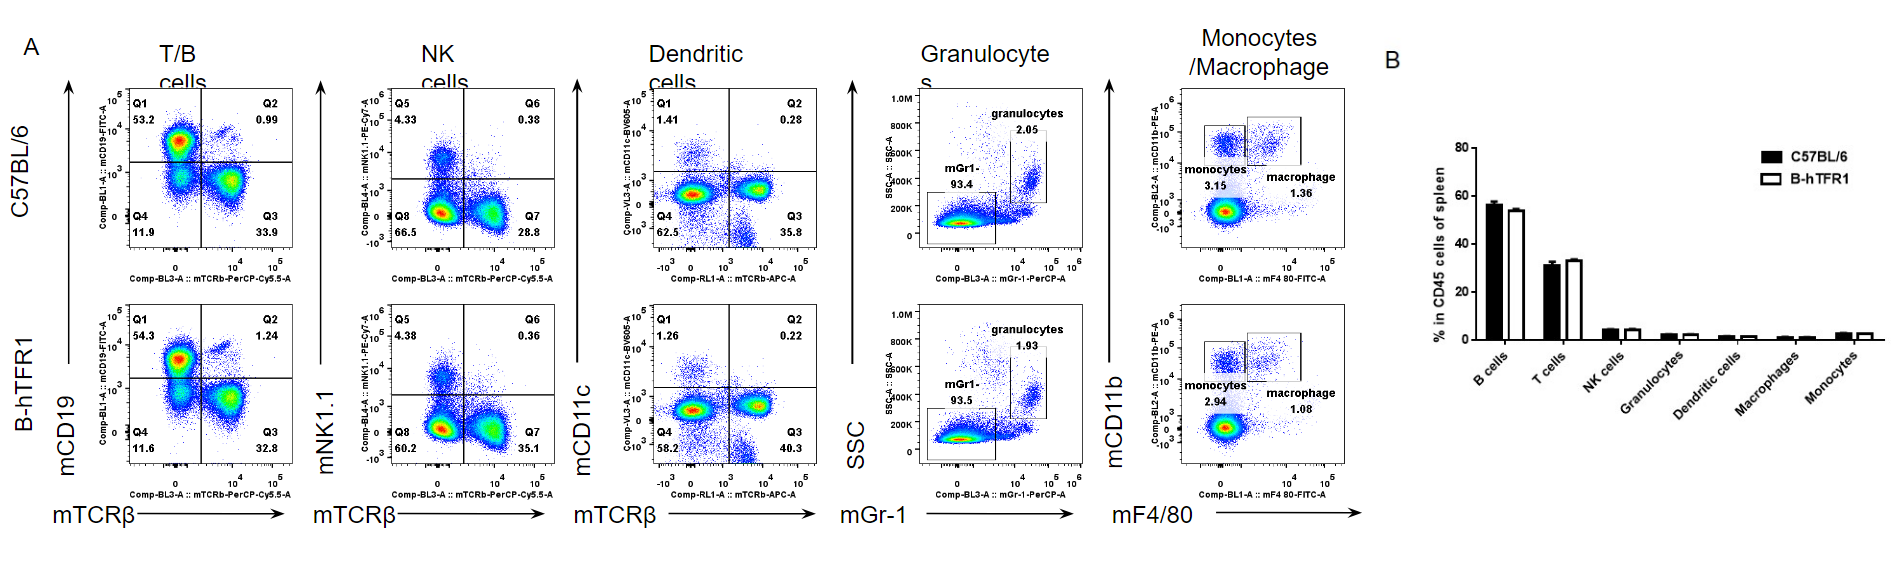
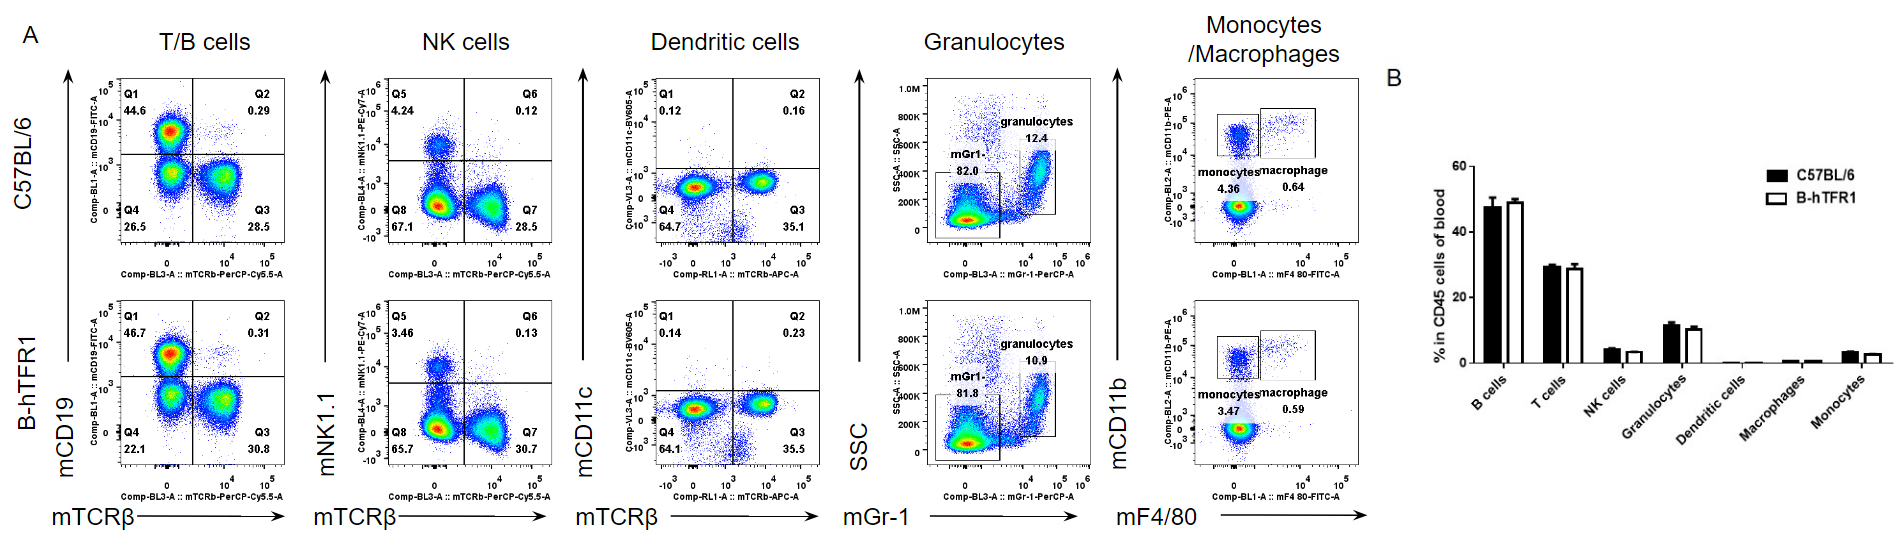
Analysis of spleen leukocyte subpopulations by FACS.
Splenocytes were isolated from female C57BL/6 and B-hTFR1 mice (n=3, 6 week-old). Flow cytometry analysis of the splenocytes was performed to assess leukocyte subpopulations. A. Representative FACS plots. Single live cells were gated for CD45 population and used for further analysis as indicated here. B. Results of FACS analysis. Percent of T cells, B cells, NK cells, dendritic cells, granulocytes, monocytes and macrophages in homozygous B-hTFR1 mice were similar to those in the C57BL/6 mice, demonstrating that introduction of hTFR1 in place of its mouse counterpart does not change the overall development, differentiation or distribution of these cell types in spleen. Values are expressed as mean ± SEM.
-
Analysis of spleen T cell subpopulations in B-hTFR1 mice
-
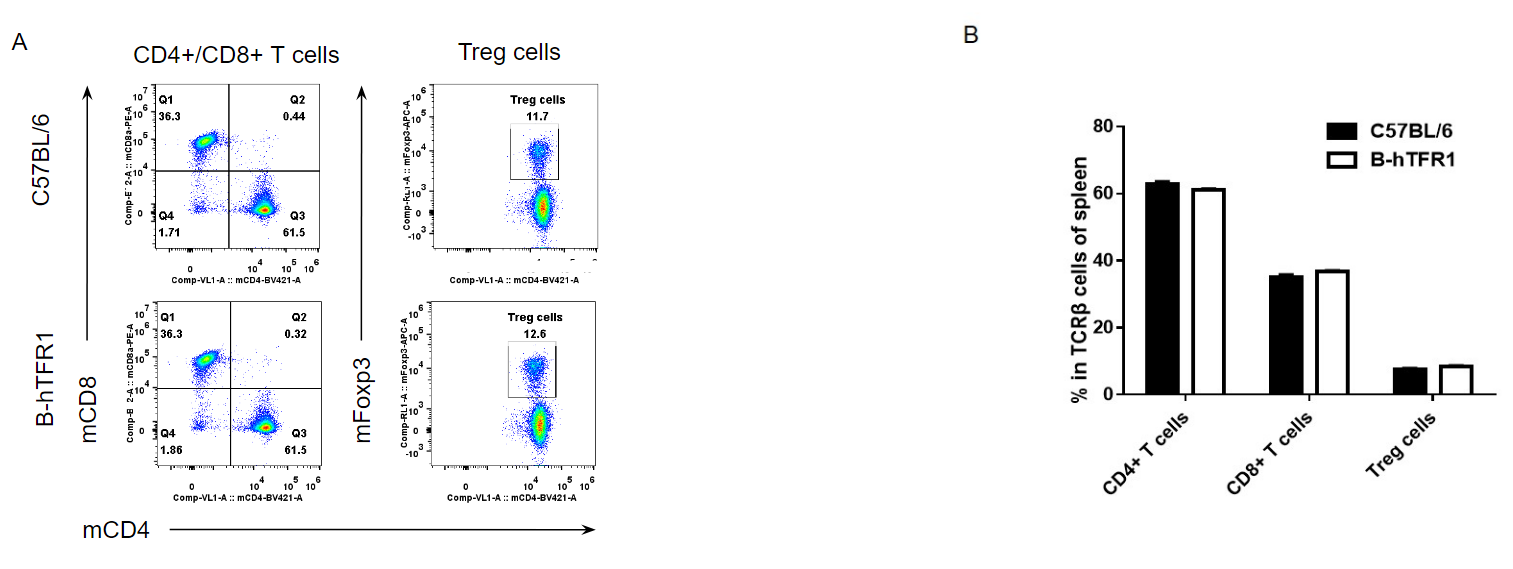
Analysis of spleen T cell subpopulations by FACS.
Splenocytes were isolated from female C57BL/6 and B-hTFR1 mice (n=3, 6 week-old). Flow cytometry analysis of the splenocytes was performed to assess leukocyte subpopulations. A. Representative FACS plots. Single live CD45+ cells were gated for CD3 T cell population and used for further analysis as indicated here. B. Results of FACS analysis. Percent of CD8+ T cells, CD4+ T cells and Treg cells in homozygous B-hTFR1 mice were similar to those in the C57BL/6 mice, demonstrating that introduction of hTFR1 in place of its mouse counterpart does not change the overall development, differentiation or distribution of these T cell sub types in spleen. Values are expressed as mean ± SEM.
-
Analysis of lymph node leukocytes cell subpopulations in B-hTFR1 mice
-
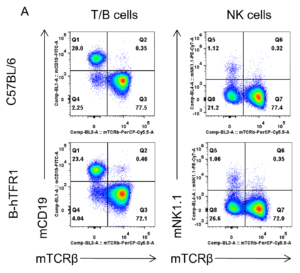
Analysis of lymph node leukocyte subpopulations by FACS.
Leukocytes were isolated from female C57BL/6 and B-hTFR1 mice (n=3, 6 week-old). Flow cytometry analysis of the leukocytes was performed to assess leukocyte subpopulations. A. Representative FACS plots. Single live cells were gated for CD45 population and used for further analysis as indicated here. B. Results of FACS analysis. Percent of T cells, B cells and NK cells in homozygous B-hTFR1 mice were similar to those in the C57BL/6 mice, demonstrating that introduction of hTFR1 in place of its mouse counterpart does not change the overall development, differentiation or distribution of these cell types in lymph node. Values are expressed as mean ± SEM.
-
Analysis of blood leukocytes cell subpopulations in B-hTFR1 mice
-
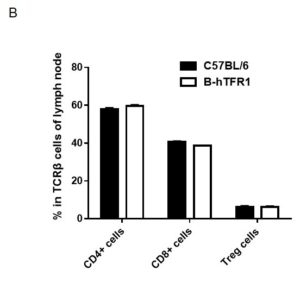
Analysis of blood leukocyte subpopulations by FACS.
Blood cells were isolated from female C57BL/6 and B-hTFR1 mice (n=3, 6 week-old). Flow cytometry analysis of the splenocytes was performed to assess leukocyte subpopulations. A. Representative FACS plots. Single live cells were gated for CD45 population and used for further analysis as indicated here. B. Results of FACS analysis. Percent of T cells, B cells, NK cells, dendritic cells, granulocytes, monocytes and macrophages in homozygous B-hTFR1 mice were similar to those in the C57BL/6 mice, demonstrating that introduction of hTFR1 in place of its mouse counterpart does not change the overall development, differentiation or distribution of these cell types in blood. Values are expressed as mean ± SEM.
-
Analysis of blood T cell subpopulations in B-hTFR1 mice
-
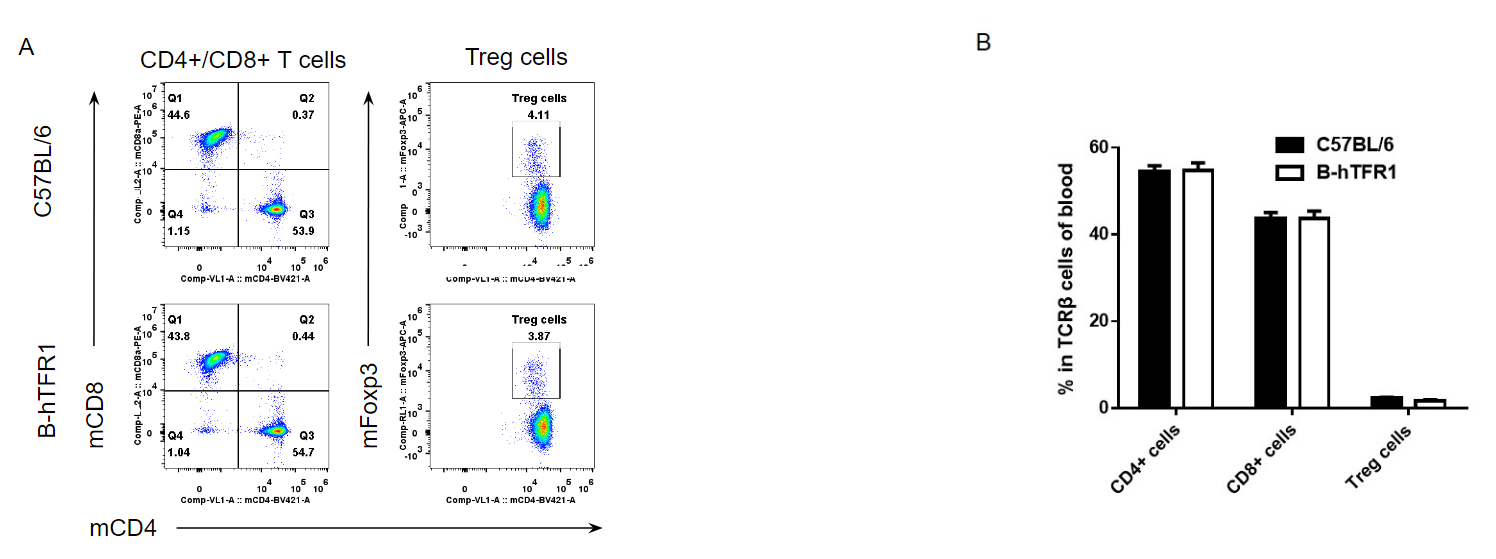
Analysis of blood T cell subpopulations by FACS.
Blood cells were isolated from female C57BL/6 and B-hTFR1 mice (n=3, 6 week-old). Flow cytometry analysis of the leukocytes was performed to assess leukocyte subpopulations. A. Representative FACS plots. Single live CD45+ cells were gated for CD3 T cell population and used for further analysis as indicated here. B. Results of FACS analysis. Percent of CD8+ T cells, CD4+ T cells and Treg cells in homozygous B-hTFR1 mice were similar to those in the C57BL/6 mice, demonstrating that introduction of hTFR1 in place of its mouse counterpart does not change the overall development, differentiation or distribution of these T cell sub types in blood. Values are expressed as mean ± SEM.
-
In vivo PK evaluation of anti-human TFR1 BsAbs
-
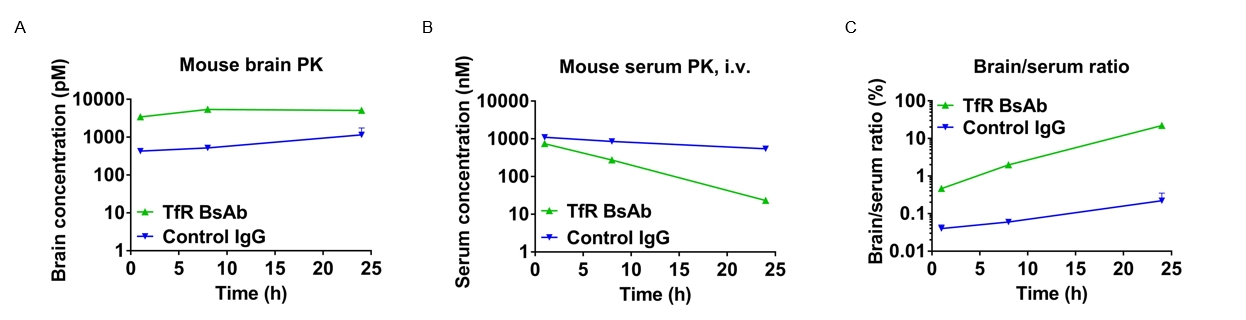
In vivo pharmacokinetic (PK) evaluation of anti-human TFR1 bispecific antibodies (BsAbs).
B-hTFR1 mice were injected with control IgG (10 mpk) and anti-human TFR1 BsAbs (10.9 mpk) provided by a client via tail vein. Brain and serum were taken for in vivo PK evaluation. Brain concentrations(A), serum concentrations (B), and brain-to-serum ratio (C) of anti-human TFR1 BsAbs were quantified. As shown in panel, anti-human TFR1 BsAbs exhibited higher serum clearance and enhanced brain exposure after dose. The results confirmed that brain of B-hTFR1 mice enables uptake of an intravenously administered anti-human TFR1 BsAbs and B-hTFR1 mice provide a powerful preclinical model for in vivo evaluation of effective delivery of protein therapeutics to the central nervous system (CNS).Graphs represent mean ± SEM.
-
Blood chemistry of B-hTFR1 mice
-
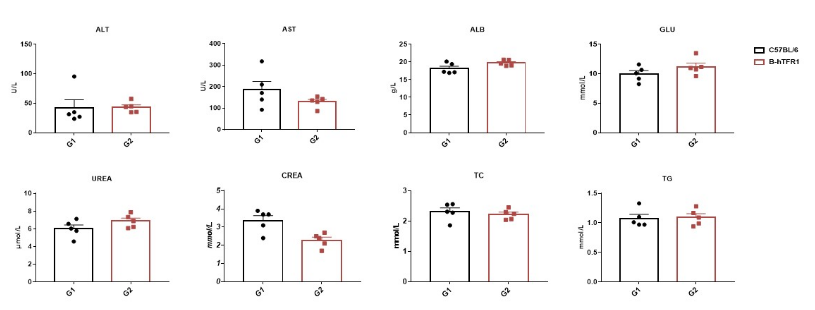
Blood chemistry tests of B-hTFR1 mice.
Serum from the C57BL/6 and B-hTFR1 mice (n=5, 6 week-old) were collected and analyzed for levels of ALT and AST. There was no differences on either measurement between C57BL/6 and B-hTFR1 mice, indicating that introduction of hTFR1 in place of its mouse counterpart does not change ALT and AST levels or health of liver. Values are expressed as mean ± SEM.
-
Blood routine test in B-hTFR1 mice
-
Complete blood count (CBC).
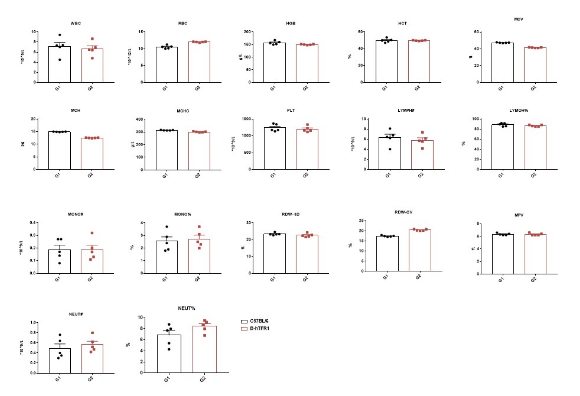
Blood from female C57BL/6 and B-hTFR1 mice (n=5, 6 week-old) were collected and analyzed for CBC. There was no differences among any measurement between C57BL/6 and B-hTFR1 mice, indicating that introduction of hTFR1 in place of its mouse counterpart does not change blood cell composition and morphology. Values are expressed as mean ± SEM.
-
Summary
-
- mRNA expression analysis:
Mouse Tfrc mRNA was detectable only in splenocytes of WT mice (+/+). Human TFRC mRNA was detectable only in homozygous B-hTFR1 mice (H/H) but not in WT mice (+/+).
- Protein expression analysis:
Human TFRC was exclusively detectable on erythroid cells of homozygous B-hTFR1 mice (H/H) but not in WT mice (+/+), and mouse TFRC was detectable only in WT mice (+/+).
Human TFR1 was exclusively detectable on brain microvascular endothelium of homozygous B-hTFR1 mice, but not in WT mice.
- Leukocytes cell subpopulation analysis:
TFR1 humanized does not change the overall development, differentiation or distribution of immune cell types in spleen, thymus and blood.
- Blood routine test and Blood biochemical test
TFR1 humanized does not change the blood cell composition and morphology, ALT and AST levels or health of liver.
-
Poster
-
Publications
-
An AAV capsid reprogrammed to bind human Transferrin Receptor mediates brain-wide gene delivery
