
Basic Information
-
Gene Targeting Strategy

-
Gene targeting strategy for B-hTGFBR2 mice. The chimeric coding sequence (including mouse signal peptide, human extracellular domain, mouse transmembrane, and intracellular domain) was inserted following part of the exon 2 of the mouse Tgfbr2 in B-hTGFBR2 mice.
-
Protein Expression Analysis
-
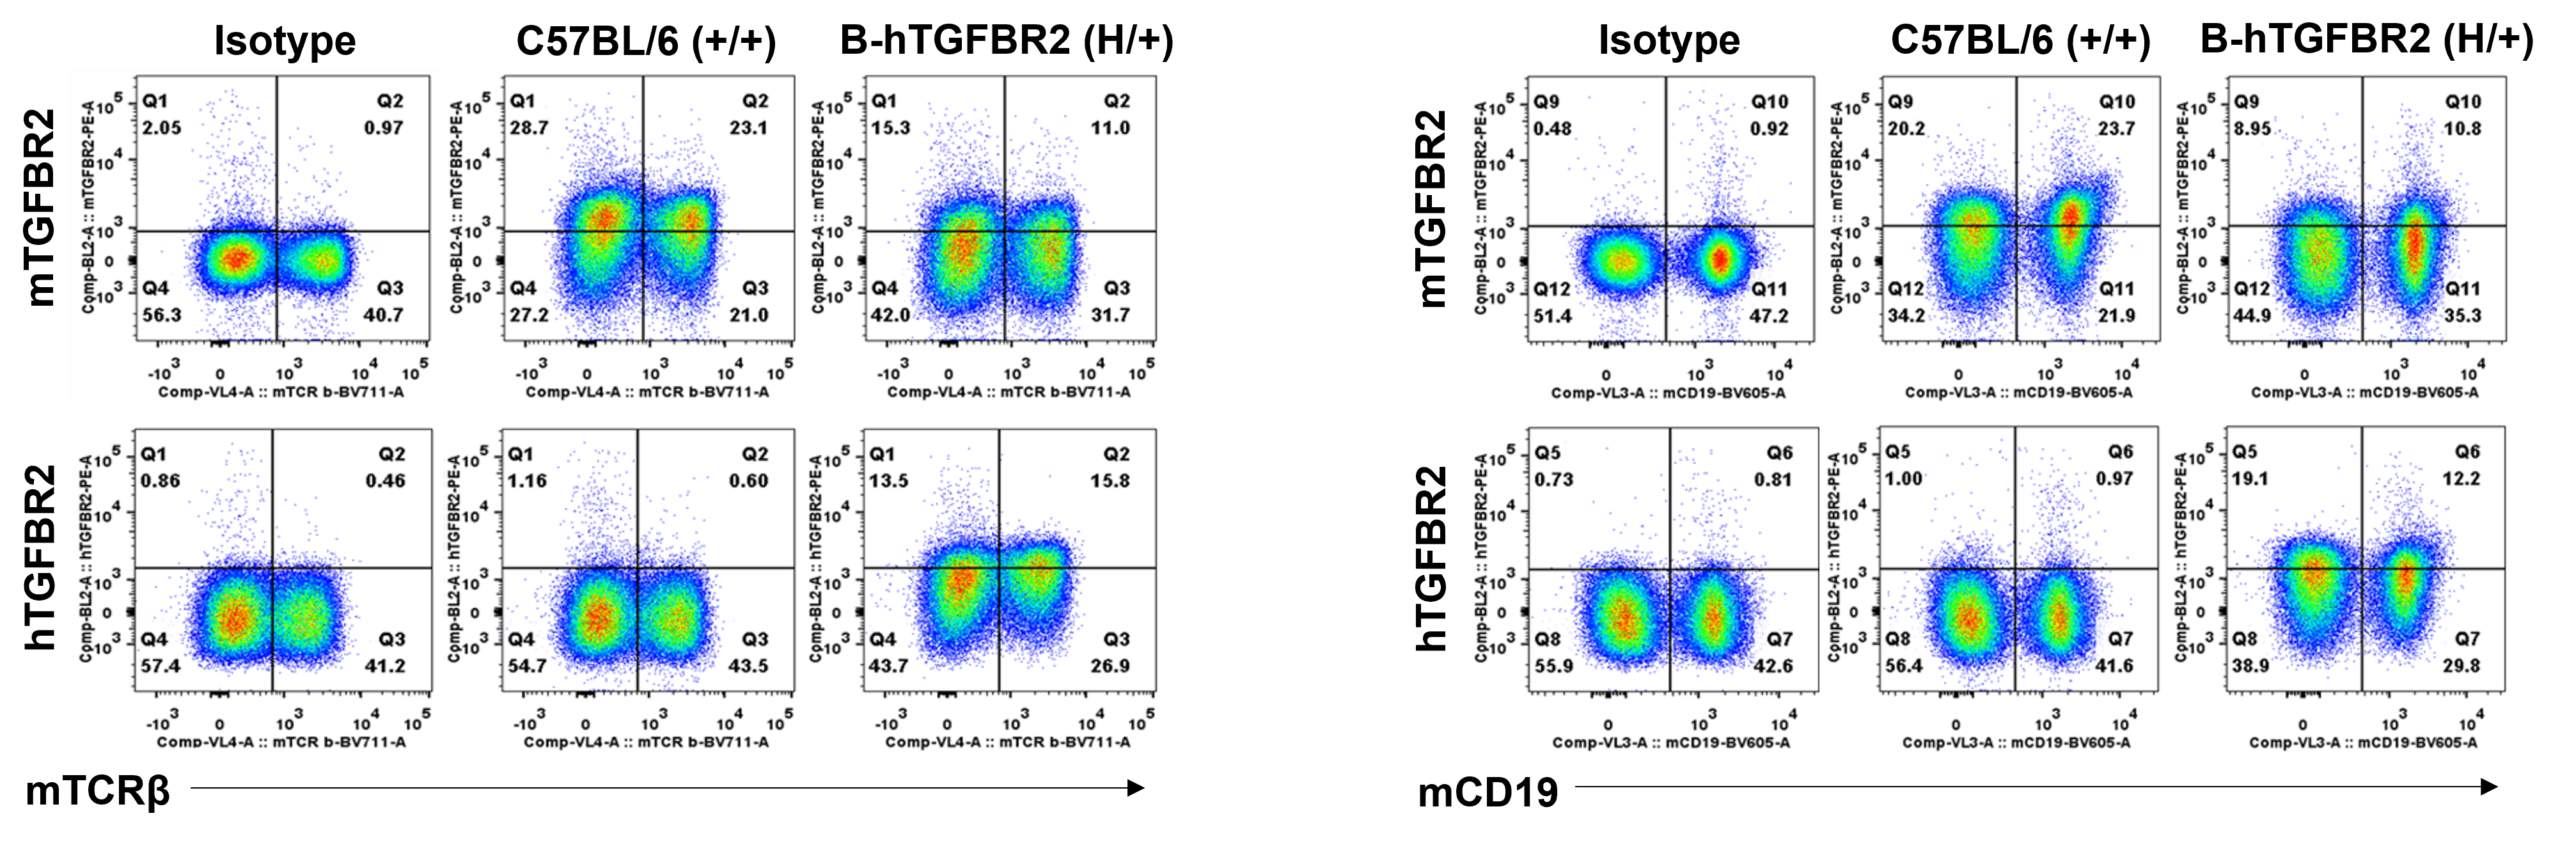
Strain specific TGFBR2 expression analysis in homozygous B-hTGFBR2 mice by flow cytometry. Splenocytes were collected from wild-type C57BL/6 mice (+/+) and homozygous B-hTGFBR2 mice, and analyzed by flow cytometry with species-specific TGFBR2 antibody. As the mouse TGFBR2 antibody cross-reacts with human TGFBR2, mouse TGFBR2 was detectable in wild-type mice and homozygous B-hTGFBR2 mice. Human TGFBR2 was exclusively detectable in homozygous B-hTGFBR2 but not wild-type mice.
-
Immune Cell Analysis
-
Analysis of leukocytes cell subpopulation in spleen


Analysis of spleen leukocyte subpopulations by FACS. Splenocytes were isolated from female C57BL/6 and homozygous B-hTGFBR2 mice (n=3, 9-week-old). Flow cytometry analysis of the splenocytes was performed to assess leukocyte subpopulations. (A) Representative FACS plots. Single live cells were gated for the CD45+ population and used for further analysis as indicated here. (B) Results of FACS analysis. Percent of T cells, B cells, NK cells, dendritic cells, granulocytes, monocytes and macrophages in homozygous B-hTGFBR2 mice were similar to those in the C57BL/6 mice, demonstrating that introduction of hTGFBR2 in place of its mouse counterpart does not change the overall development, differentiation or distribution of these cell types in spleen. Values are expressed as mean ± SEM.
Analysis of T cell subpopulation in spleen

Analysis of spleen T cell subpopulations by FACS. Splenocytes were isolated from female C57BL/6 and homozygous B-hTGFBR2 mice(n=3, 9-week-old). Flow cytometry analysis of the splenocytes was performed to assess leukocyte subpopulations. (A) Representative FACS plots. Single live CD45+ cells were gated for CD3+ T cell population and used for further analysis as indicated here. (B) Results of FACS analysis. The percent of CD8+ T cells, CD4+ T cells, and Tregs in homozygous B-hTGFBR2 mice were similar to those in the C57BL/6 mice, demonstrating that introduction of hTGFBR2 in place of its mouse counterpart does not change the overall development, differentiation or distribution of these T cell subtypes in spleen. Values are expressed as mean ± SEM.
Analysis of leukocytes cell subpopulation in lymph node

Analysis of lymph node leukocyte subpopulations by FACS. Leukocytes were isolated from female C57BL/6 and homozygous B-hTGFBR2 mice (n=3, 9-week-old). Flow cytometry analysis of the lymph node leukocyte was performed to assess leukocyte subpopulations. (A) Representative FACS plots. Single live cells were gated for the CD45+ population and used for further analysis as indicated here. (A) Results of FACS analysis. Percent of T cells, B cells and NK cells in homozygous B-hTGFBR2 mice were similar to those in the C57BL/6 mice, demonstrating that introduction of hTGFBR2 in place of its mouse counterpart does not change the overall development, differentiation or distribution of these cell types in lymph node. Values are expressed as mean ± SEM.
Analysis of T cell subpopulation in lymph node

Analysis of lymph node T cell subpopulations by FACS. Leukocytes were isolated from female C57BL/6 and homozygous B-hTGFBR2 mice (n=3, 9-week-old). Flow cytometry analysis of the leukocytes was performed to assess leukocyte subpopulations. (A) Representative FACS plots. Single live CD45+ cells were gated for CD3+ T cell population and used for further analysis as indicated here. (B) Results of FACS analysis. The percent of CD8+ T cells, and Tregs in homozygous B-hTGFBR2 mice were similar to those in the C57BL/6 mice, demonstrating that introduction of hTGFBR2 in place of their mouse counterpart does not change the overall development, differentiation or distribution of these T cell subtypes in lymph node. Values are expressed as mean ± SEM.
Analysis of leukocytes cell subpopulation in blood


Analysis of blood leukocyte subpopulations by FACS. Blood cells were isolated from female C57BL/6 and homozygous B-hTGFBR2 mice (n=3, 9-week-old). Flow cytometry analysis of the blood leukocyte subpopulations was performed to assess leukocyte subpopulations. (A) Representative FACS plots. Single live cells were gated for the CD45+ population and used for further analysis as indicated here. (B) Results of FACS analysis. Percent of T cells, B cells, NK cells, dendritic cells, granulocytes, monocytes and macrophages in homozygous B-hTGFBR2 mice were similar to those in the C57BL/6 mice, demonstrating that introduction of hTGFBR2 in place of their mouse counterpart does not change the overall development, differentiation or distribution of these cell types in blood. Values are expressed as mean ± SEM.
Analysis of T cell subpopulation in blood

Analysis of blood T cell subpopulations by FACS. Blood cells were isolated from female C57BL/6 and homozygous B-hTGFBR2 mice (n=3, 9-week-old). Flow cytometry analysis of the blood leukocyte subpopulations was performed to assess leukocyte subpopulations. (A) Representative FACS plots. Single live CD45+ cells were gated for CD3+ T cell population and used for further analysis as indicated here. (B) Results of FACS analysis. The percent of CD8+ T cells, CD4+ T cells, and Tregs in homozygous B-hTGFBR2 mice were similar to those in the C57BL/6 mice, demonstrating that introduction of hTGFBR2 in place of their mouse counterpart does not change the overall development, differentiation or distribution of these T cell subtypes in blood. Values are expressed as mean ± SEM.
-
Antibody Binding Assay
-

Strain specific TGFBR2 expression analysis in homozygous B-hTGFBR2 mice by flow cytometry. Spleens were collected from wild-type mice (+/+) and homozygous B-hTGFBR2 mice, and analyzed by flow cytometry with anti-TGFBR2 antibody. Human TGFBR2 was exclusively detectable in homozygous B-hTGFBR2 but not in wild-type mice.
-
Summary
-
mRNA expression:
Mouse Tgfbr2 mRNA was detectable in splenocytes of wild-type (+/+) mice. Human Tgfbr2 mRNA was detectable only in homozygous B-hTGFBR2 mice, but not in wild-type (+/+) mice.
Protein expression analysis:
Human TGFBR2 was exclusively detectable in homozygous B-hTGFBR2 mice but not wild-type mice, and mouse TGFBR2 was detectable in wild-type mice.
Leukocytes profile:
Percentages of T, B, NK cells, monocyte/macrophages, and DC were similar in homozygous B-hTGFBR2 mice and wild-type (+/+) mice, demonstrating that introduction of hTGFBR2 in place of its mouse counterpart does not change the overall development, differentiation, or distribution of these cell types in spleen, lymph node leukocytes and blood.
