
Basic Information
-
Targeting strategy

-
Gene targeting strategy for B-Fcgr1/Fcgrs KO mice. All sequences from upstream of Fcgr3 gene to the 3’UTR of Fcgr2b gene and the 5’UTR and exons 1~6 of mouse Fcgr1 were deleted in the B-Fcgr1/Fcgrs KO mice.
-
Protein expression analysis in spleen-mFcgr1
-
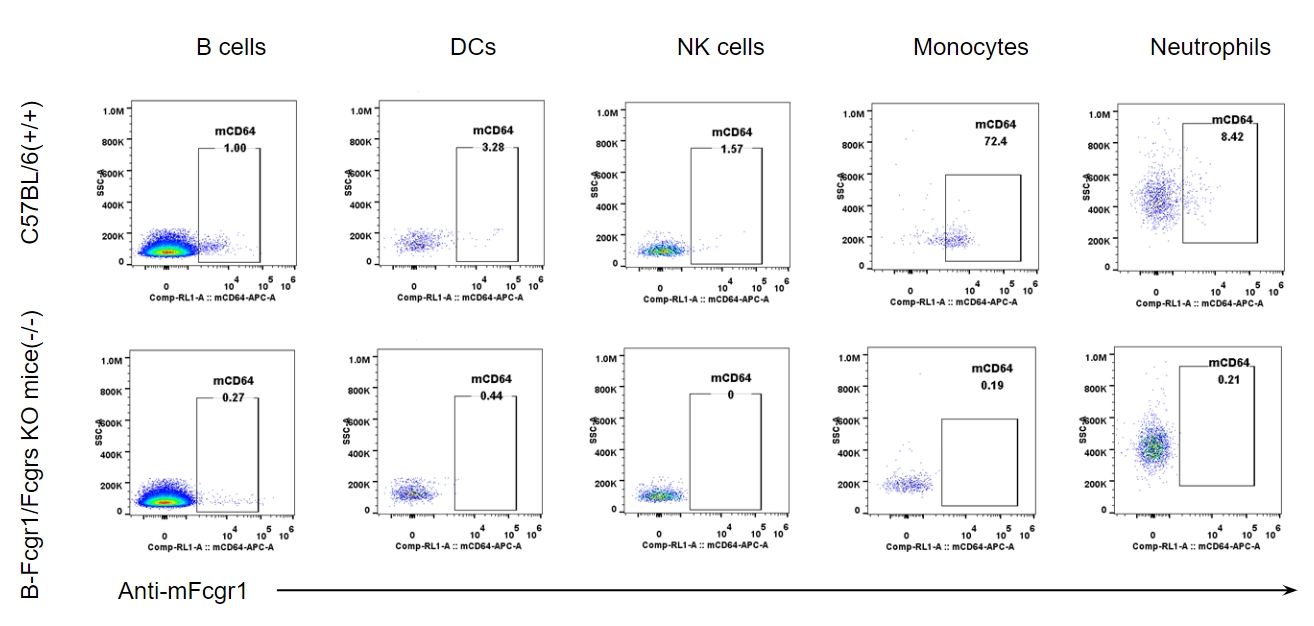
Strain specific mFcgr1 expression analysis in wild-type mice and B-Fcgr1/Fcgrs KO mice by flow cytometry. Splenocytes were collected from wild-type C57BL/6 mice and B-Fcgr1/Fcgrs KO mice. Mouse Fcgr1 was detectable in B cells, DCs, NK cells, monocytes and neutrophils of wild-type mice. Mouse Fcgr1 was not detectable in B cells, DCs, NK cells, monocytes or neutrophils of B-Fcgr1/Fcgrs KO mice.
-
Protein expression analysis in bone marrow-mFcgr1
-

Strain specific mFcgr1 expression analysis in wild-type mice and B-Fcgr1/Fcgrs KO mice by flow cytometry. Bone marrow was collected from wild-type C57BL/6 mice and B-Fcgr1/Fcgrs KO mice. Mouse Fcgr1 was detectable in B cells, DCs, NK cells, monocytes and neutrophils of wild-type mice. Mouse Fcgr1 was not detectable in B cells, DCs, NK cells, monocytes or neutrophils of B-Fcgr1/Fcgrs KO mice.
-
Protein expression analysis in spleen-mFcgrs
-
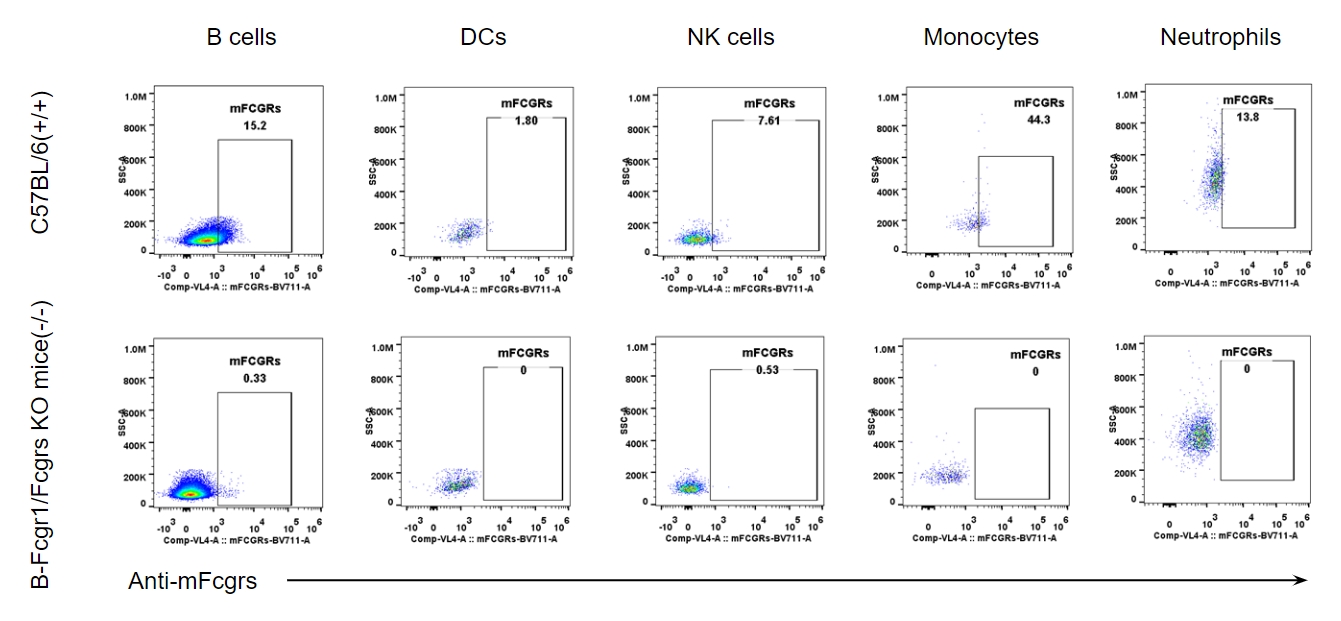
Strain specific mFcgrs expression analysis in wild-type mice and B-Fcgr1/Fcgrs KO mice by flow cytometry. Splenocytes were collected from wild-type C57BL/6 mice and B-Fcgr1/Fcgrs KO mice. Mouse Fcgrs were detectable in B cells, DCs, NK cells, monocytes and neutrophils of wild-type mice. Mouse Fcgrs were not detectable in B cells, DCs, NK cells, monocytes or neutrophils of B-Fcgr1/Fcgrs KO mice.
-
Protein expression analysis in bone marrow-mFcgrs
-

Strain specific mFcgrs expression analysis in wild-type mice and B-Fcgr1/Fcgrs KO mice by flow cytometry. Bone marrow was collected from wild-type C57BL/6 mice and B-Fcgr1/Fcgrs KO mice. Mouse Fcgrs were detectable in B cells, DCs, monocytes and neutrophils of wild-type mice. Mouse Fcgrs were not detectable in B cells, DCs, NK cells, monocytes or neutrophils of B-Fcgr1/Fcgrs KO mice.
-
Analysis of leukocytes cell subpopulation in spleen
-
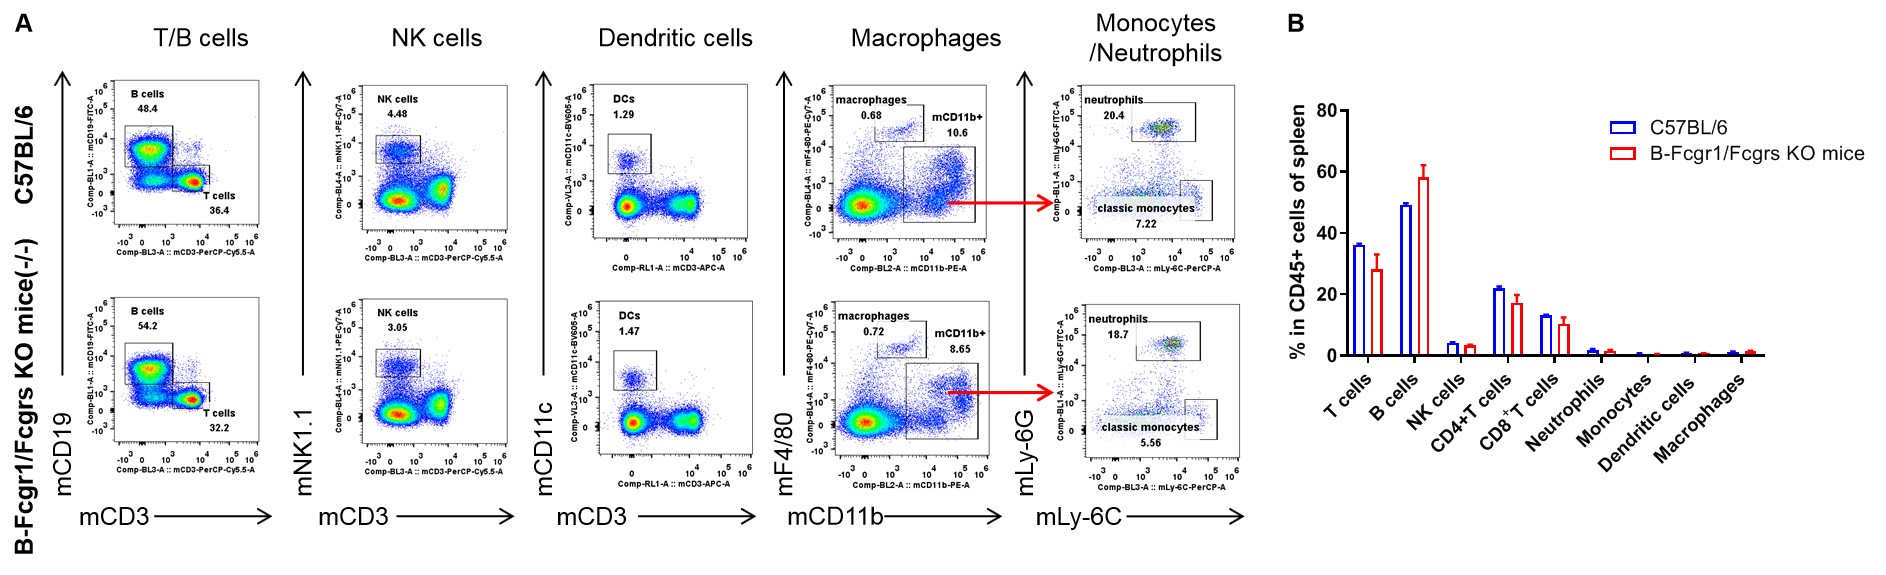
Analysis of spleen leukocyte subpopulations by FACS. Splenocytes were collected from WT and B-Fcgr1/Fcgrs KO mice (n=3, 7-week-old). Flow cytometry analysis of the splenocytes was performed to assess leukocyte subpopulations. A. Representative FACS plots. Single live cells were gated for the CD45+ population and used for further analysis as indicated here. B. Results of FACS analysis. Percent of T cells, B cells,NK cells, dendritic cells, granulocytes, monocytes and macrophages in B-Fcgr1/Fcgrs KO mice were similar to those in the C57BL/6 mice, demonstrating that deleting of Fcgr1/Fcgrs does not change the overall development, differentiation or distribution of these cell subtypes in blood. Values are expressed as mean ± SEM.
-
Analysis of T cell subpopulation in spleen
-
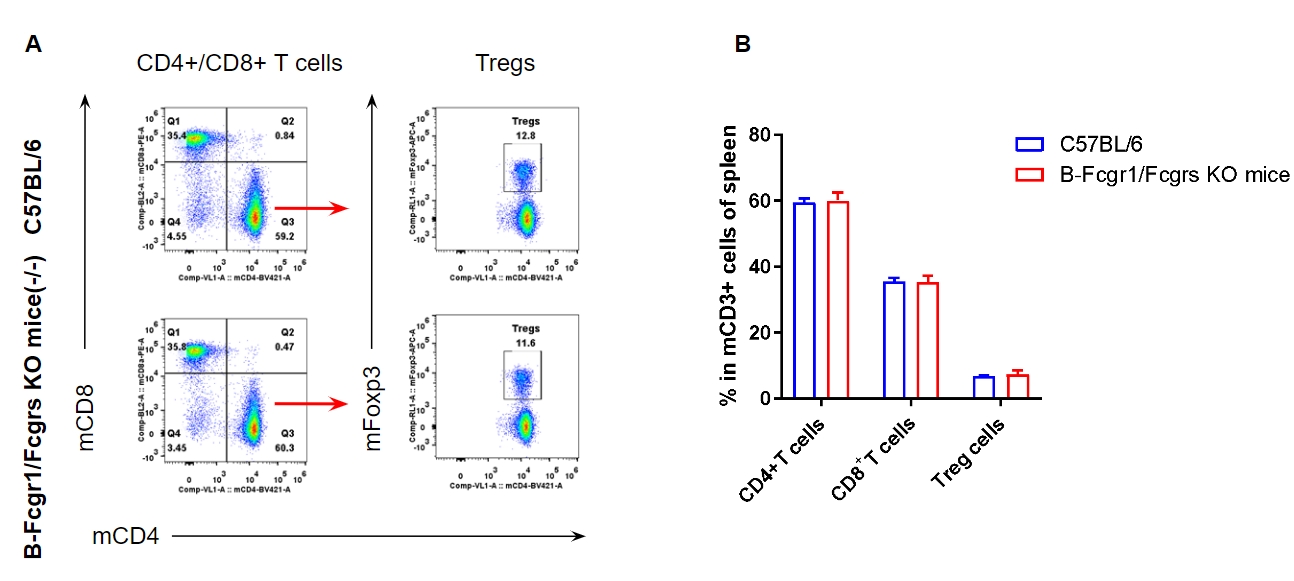
Analysis of spleen T cell subpopulations by FACS. Splenocytes were isolated from female C57BL/6 and B-Fcgr1/Fcgrs KO mice (n=3, 7-week-old). Flow cytometry analysis of the splenocytes was performed to assess leukocyte subpopulations. A. Representative FACS plots. Single live CD45+ cells were gated for CD3+ T cell population and used for further analysis as indicated here. B. Results of FACS analysis. The percent of CD8+ T cells, CD4+ T cells, and Tregs in B-Fcgr1/Fcgrs KO mice were similar to those in the C57BL/6 mice. Values are expressed as mean ± SEM.
-
Analysis of leukocytes cell subpopulation in blood
-
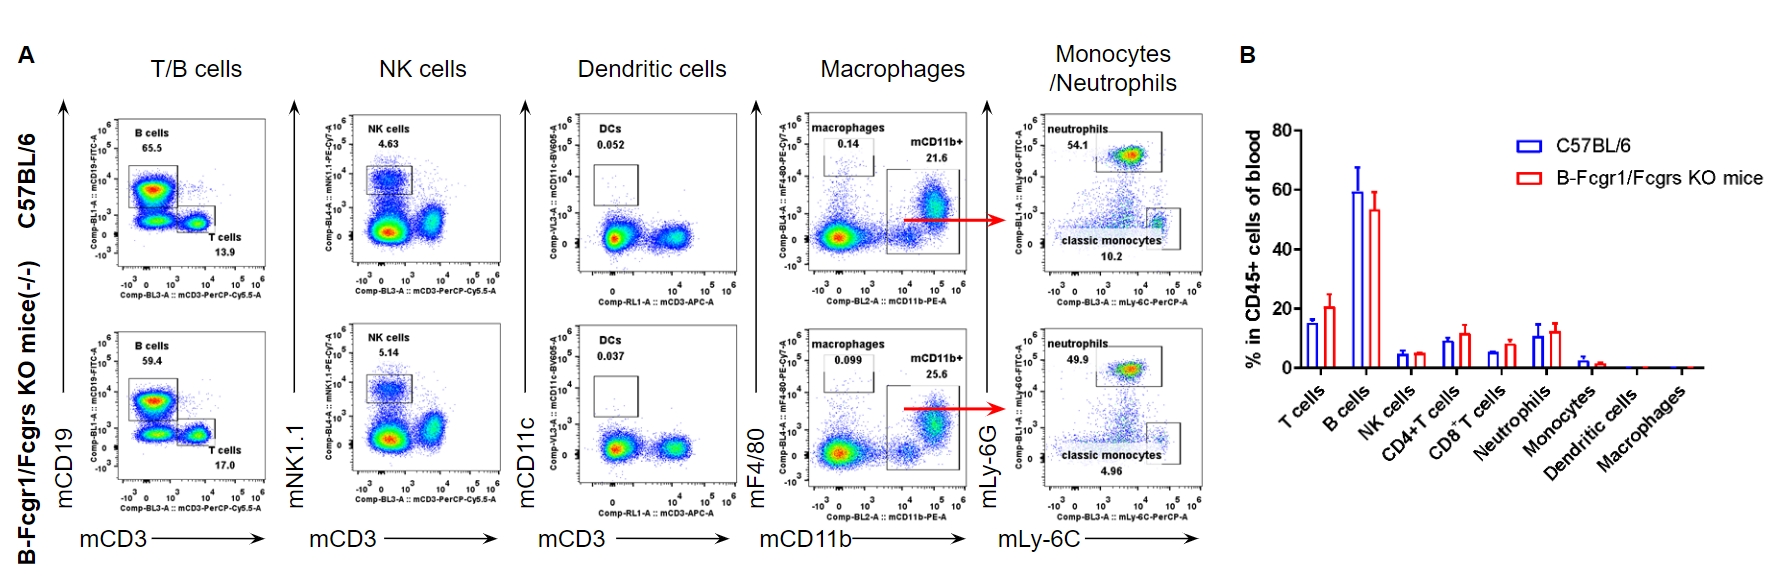
Analysis of blood leukocyte subpopulations by FACS. Blood cells were collected from WT and B-Fcgr1/Fcgrs KO mice (n=3, 7-week-old). Flow cytometry analysis of the splenocytes was performed to assess leukocyte subpopulations. A. Representative FACS plots. Single live cells were gated for the CD45+ population and used for further analysis as indicated here. B. Results of FACS analysis. Percent of T cells, B cells, NK cells, dendritic cells, granulocytes, monocytes and macrophages in B-Fcgr1/Fcgrs KO mice were similar to those in the C57BL/6 mice, demonstrating that deleting of Fcgr1/Fcgrs does not change the overall development, differentiation or distribution of these cell subtypes in blood. Values are expressed as mean ± SEM.
-
Analysis of T cell subpopulation in blood
-
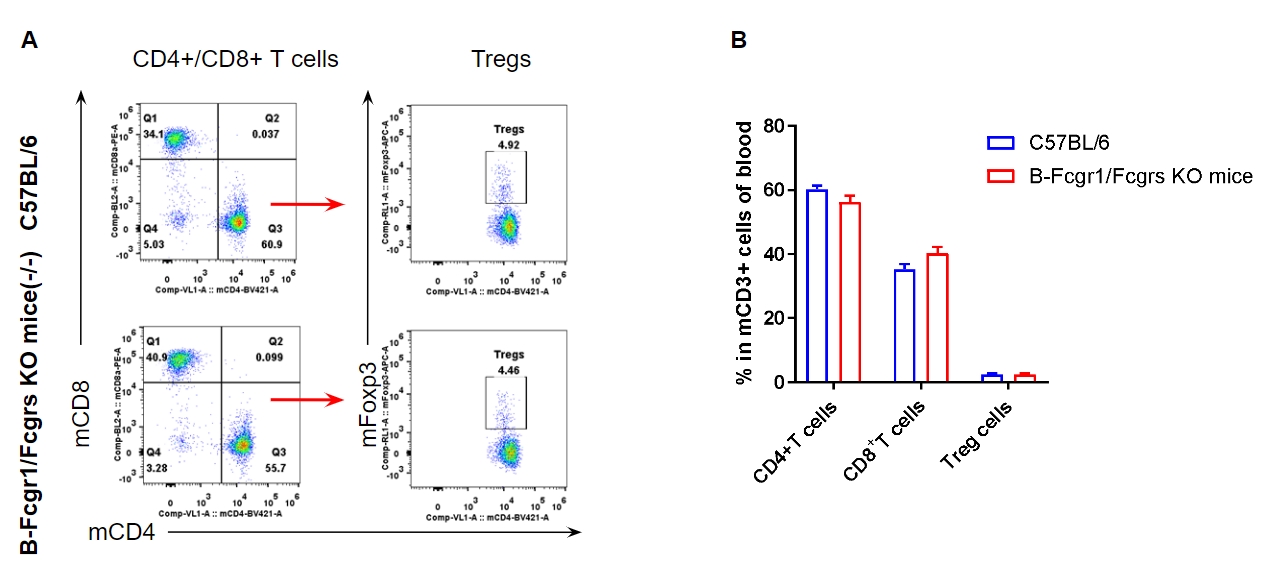
Analysis of blood T cell subpopulations by FACS. Blood cells were isolated from female C57BL/6 and B-Fcgr1/Fcgrs KO mice (n=3, 7-week-old). Flow cytometry analysis of the splenocytes was performed to assess leukocyte subpopulations. A. Representative FACS plots. Single live CD45+ cells were gated for CD3+ T cell population and used for further analysis as indicated here. B. Results of FACS analysis. The percent of CD8+ T cells, CD4+ T cells, and Tregs in B-Fcgr1/Fcgrs KO mice were similar to those in the C57BL/6 mice, demonstrating that deleting of Fcgr1/Fcgrs does not change the overall development, differentiation or distribution of these T cell subtypes in blood. Values are expressed as mean ± SEM.
-
Analysis of leukocytes cell subpopulation in lymph node
-

Analysis of lymph node leukocyte subpopulations by FACS. Lymph nodes were collected from WT and B-Fcgr1/Fcgrs KO mice (n=3, 7-week-old). Flow cytometry analysis of the splenocytes was performed to assess leukocyte subpopulations. A. Representative FACS plots. Single live cells were gated for the CD45+ population and used for further analysis as indicated here. B. Results of FACS analysis. Percent of T cells, B cells and NK cells in B-Fcgr1/Fcgrs KO mice were similar to those in the C57BL/6 mice, demonstrating that deleting of Fcgr1/Fcgrs does not change the overall development, differentiation or distribution of these cell subtypes in lymph node. Values are expressed as mean ± SEM.
-
Analysis of T cell subpopulation in lymph node
-
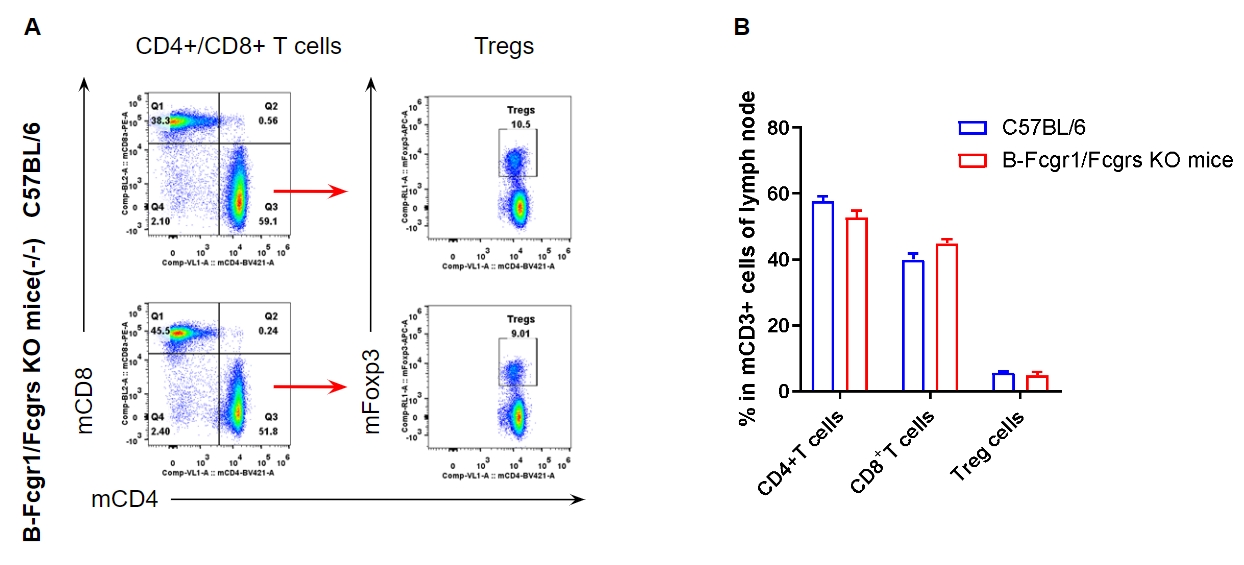
Analysis of lymph node T cell subpopulations by FACS. Lymph nodes were isolated from female C57BL/6 and B-Fcgr1/Fcgrs KO mice (n=3, 7-week-old). Flow cytometry analysis of the splenocytes was performed to assess leukocyte subpopulations. A. Representative FACS plots. Single live CD45+ cells were gated for CD3+ T cell population and used for further analysis as indicated here. B. Results of FACS analysis. The percent of CD8+ T cells, CD4+ T cells, and Tregs in B-Fcgr1/Fcgrs KO mice were similar to those in the C57BL/6 mice, demonstrating that deleting of Fcgr1/Fcgrs does not change the overall development, differentiation or distribution of these T cell subtypes in lymph node. Values are expressed as mean ± SEM.
-
Summary
-
Protein expression analysis:
Mouse Fcgr1 and Fcgrs were detectable in B cells, DCs, NK cells, monocytes and neutrophils of wild-type mice. Mouse Fcgr1 and Fcgrs were not detectable in B cells, DCs, NK cells, monocytes or neutrophils of B-Fcgr1/Fcgrs KO mice.
Leukocytes profile:
Percentages of T, B, NK cells, monocyte/macrophages, and DC were similar in B-Fcgr1/Fcgrs KO mice and wild-type mice, demonstrating that deleting of Fcgr1/Fcgrs does not change the overall development, differentiation, or distribution of these cell types in spleen, lymph node leukocytes and blood.
