mRNA expression analysis
Strain specific analysis of CD36 gene expression in wild-type mice and B-hCD36 mice by RT-PCR. Mouse Cd36 mRNA was detectable in lung of wild-type mice (+/+). Human CD36 mRNA was detectable only in homozygous B-hCD36 mice but not in wild-type mice.
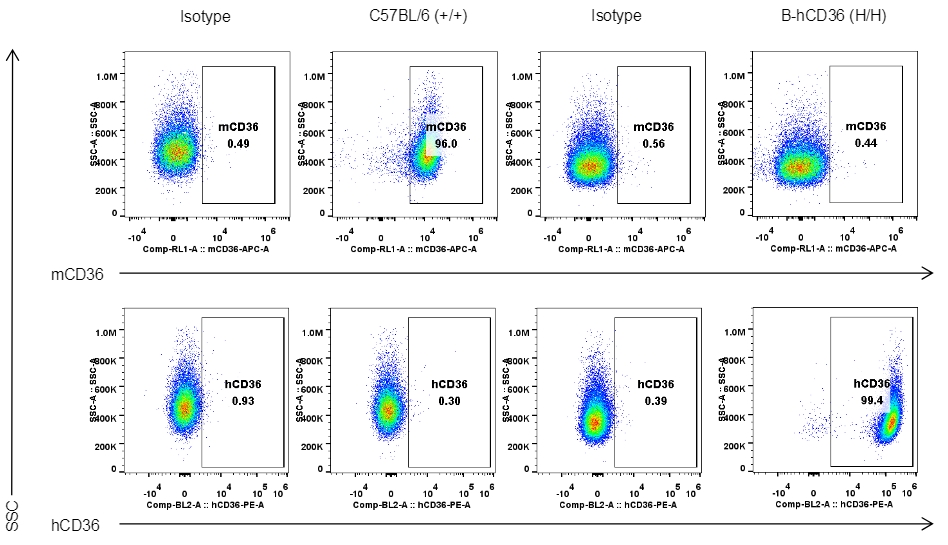
Protein expression analysis in macrophages
Strain specific CD36 expression analysis in homozygous B-hCD36 mice by flow cytometry. Peritoneal exudative macrophages were collected from wild-type mice (+/+) and homozygous B-hCD36 mice (H/H), and analyzed by flow cytometry with species-specific anti-CD36 antibody. Human CD36 was exclusively detectable in homozygous B-hCD36 mice but not in wild-type mice.
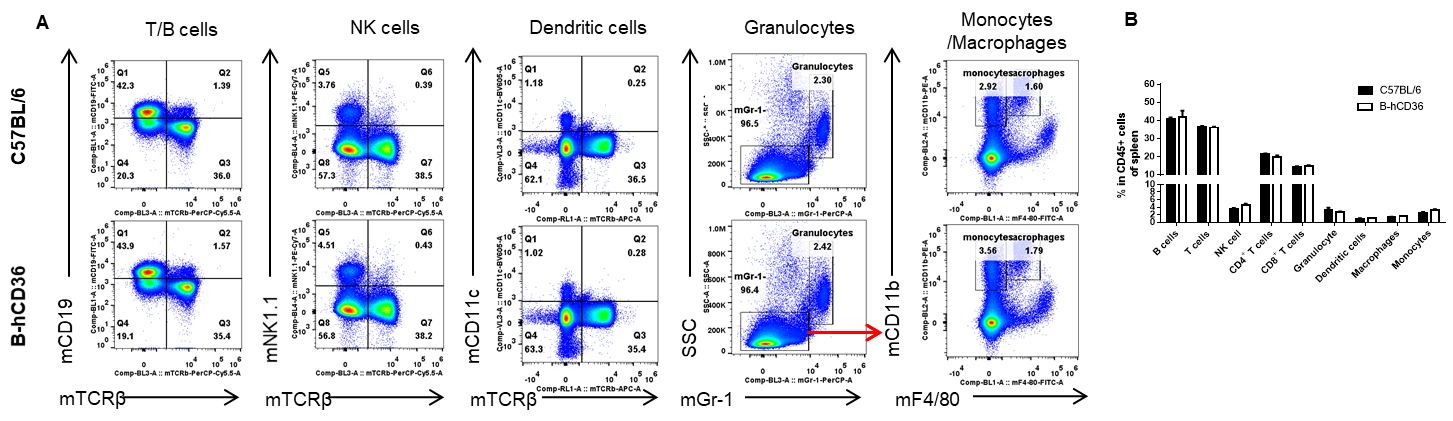
Analysis of leukocytes cell subpopulation in spleen
Analysis of spleen leukocyte subpopulations by FACS. Splenocytes were isolated from female C57BL/6 and B-hCD36 mice (n=3, 8-week-old). Flow cytometry analysis of the splenocytes was performed to assess leukocyte subpopulations. A. Representative FACS plots. Single live cells were gated for the CD45+ population and used for further analysis as indicated here. B. Results of FACS analysis. Percent of T cells, B cells, NK cells, dendritic cells, granulocytes, monocytes and macrophages in homozygous B-hCD36 mice were similar to those in the C57BL/6 mice, demonstrating that CD36 humanized does not change the overall development, differentiation or distribution of these cell types in spleen. Values are expressed as mean ± SEM.
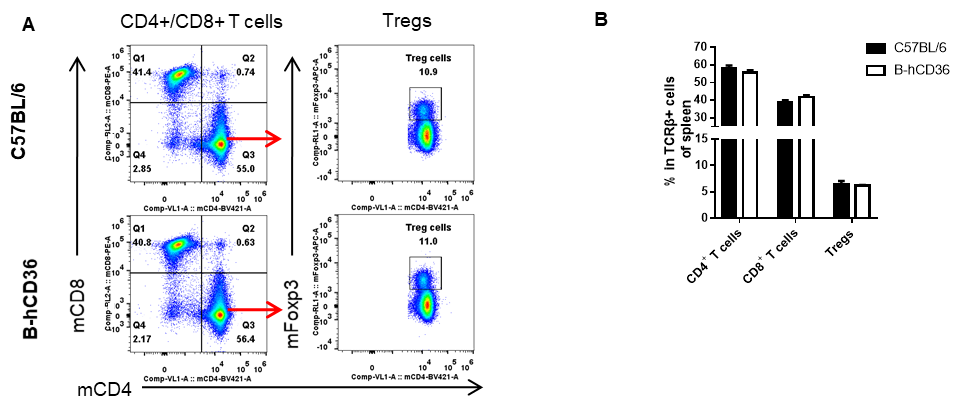
Analysis of T cell subpopulation in spleen
Analysis of spleen T cell subpopulations by FACS. Splenocytes were isolated from female C57BL/6 and B-hCD36 mice (n=3, 8-week-old). Flow cytometry analysis of the splenocytes was performed to assess leukocyte subpopulations. A. Representative FACS plots. Single live CD45+ cells were gated for TCRβ+ T cell population and used for further analysis as indicated here. B. Results of FACS analysis. The percent of CD4+ T cells, CD8+ T cells and Tregs in homozygous B-hCD36 mice were similar to those in the C57BL/6 mice, demonstrating that introduction of hCD36 in place of its mouse counterpart does not change the overall development, differentiation or distribution of these T cell subtypes in spleen. Values are expressed as mean ± SEM.
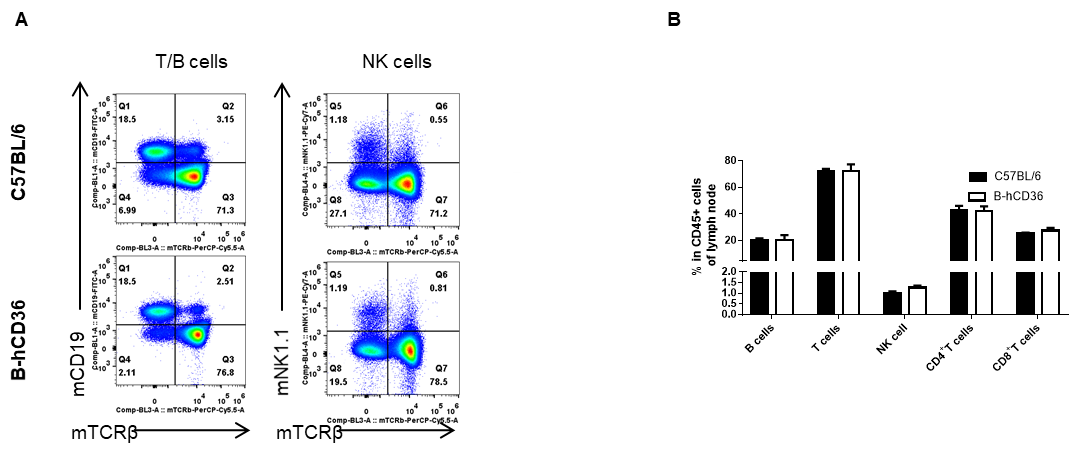
Analysis of leukocytes cell subpopulation in lymph node
Analysis of lymph node leukocyte subpopulations by FACS. Lymph nodes were isolated from female C57BL/6 and B-hCD36 mice (n=3, 8-week-old). Flow cytometry analysis of the lymph nodes was performed to assess leukocyte subpopulations. A. Representative FACS plots. Single live cells were gated for the CD45+ population and used for further analysis as indicated here. B. Results of FACS analysis. Percent of T cells, B cells, and NK cells in homozygous B-hCD36 mice were similar to those in the C57BL/6 mice, demonstrating that CD36 humanized does not change the overall development, differentiation or distribution of these cell types in lymph node. Values are expressed as mean ± SEM.
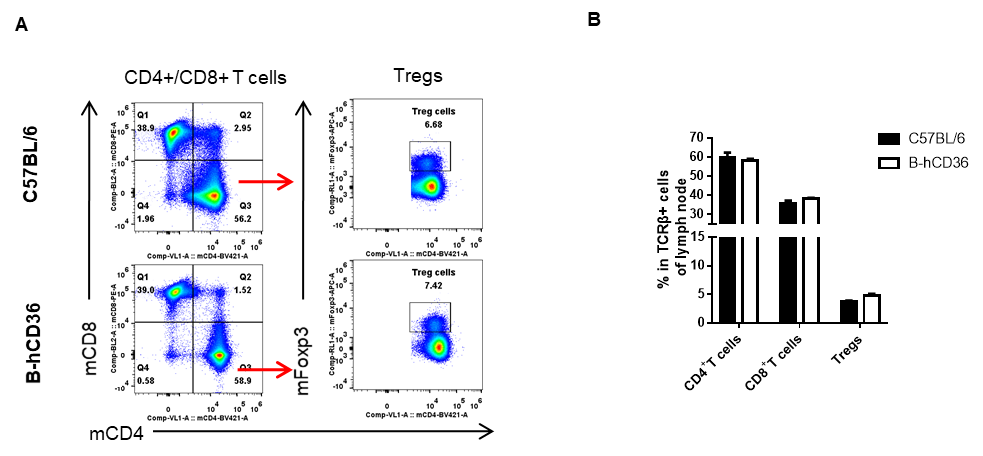
Analysis of T cell subpopulation in lymph node
Analysis of lymph node T cell subpopulations by FACS. Lymph nodes were isolated from female C57BL/6 and B-hCD36 mice (n=3, 8-week-old). Flow cytometry analysis of the lymph node was performed to assess leukocyte subpopulations. A. Representative FACS plots. Single live CD45+ cells were gated for TCRβ+ T cell population and used for further analysis as indicated here. B. Results of FACS analysis. The percent of CD4+ T cells, CD8+ T cells and Tregs in homozygous B-hCD36 mice were similar to those in the C57BL/6 mice, demonstrating that introduction of hCD36 in place of its mouse counterpart does not change the overall development, differentiation or distribution of these T cell subtypes in lymph node. Values are expressed as mean ± SEM.
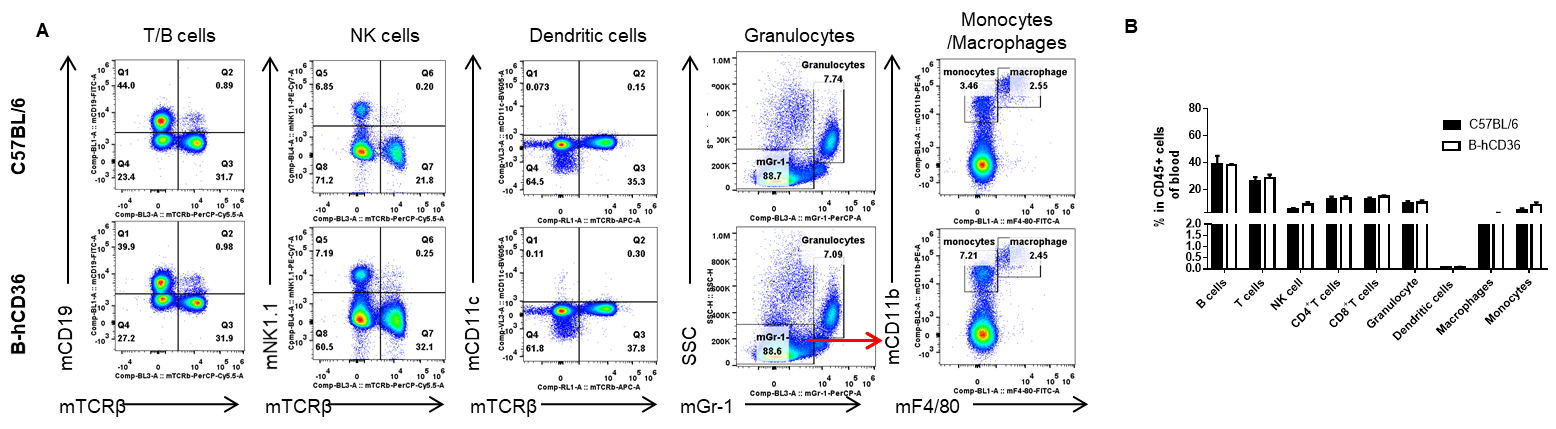
Analysis of leukocytes cell subpopulation in blood
Analysis of blood leukocyte subpopulations by FACS. Blood was isolated from female C57BL/6 and B-hCD36 mice (n=3, 8-week-old). Flow cytometry analysis of the blood was performed to assess leukocyte subpopulations. A. Representative FACS plots. Single live cells were gated for the CD45+ population and used for further analysis as indicated here. B. Results of FACS analysis. Percent of T cells, B cells, NK cells, dendritic cells, granulocytes, monocytes and macrophages in homozygous B-hCD36 mice were similar to those in the C57BL/6 mice, demonstrating that CD36 humanized does not change the overall development, differentiation or distribution of these cell types in blood. Values are expressed as mean ± SEM.
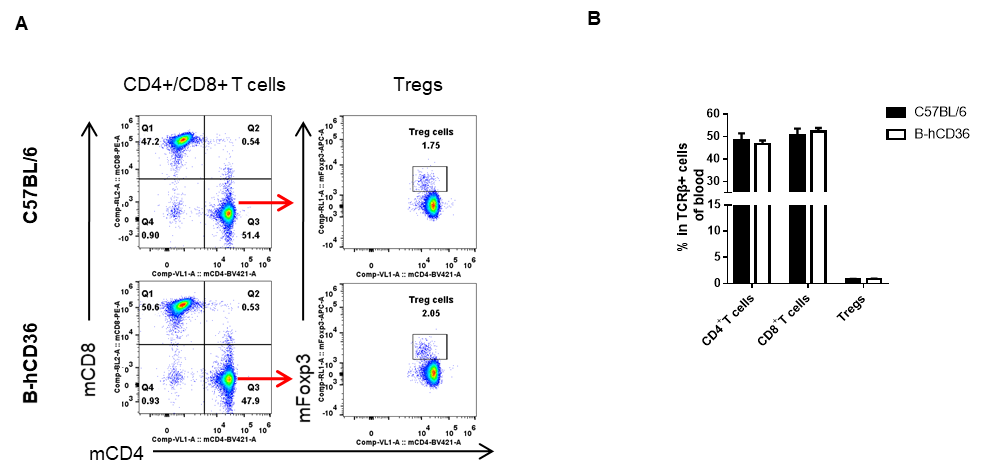
Analysis of T cell subpopulation in blood
Analysis of blood T cell subpopulations by FACS. Blood was isolated from female C57BL/6 and B-hCD36 mice (n=3, 8-week-old). Flow cytometry analysis of the blood was performed to assess leukocyte subpopulations. A. Representative FACS plots. Single live CD45+ cells were gated for TCRβ+ T cell population and used for further analysis as indicated here. B. Results of FACS analysis. The percent of CD4+ T cells, CD8+ T cells and Tregs in homozygous B-hCD36 mice were similar to those in the C57BL/6 mice, demonstrating that introduction of hCD36 in place of its mouse counterpart does not change the overall development, differentiation or distribution of these T cell subtypes in blood. Values are expressed as mean ± SEM.
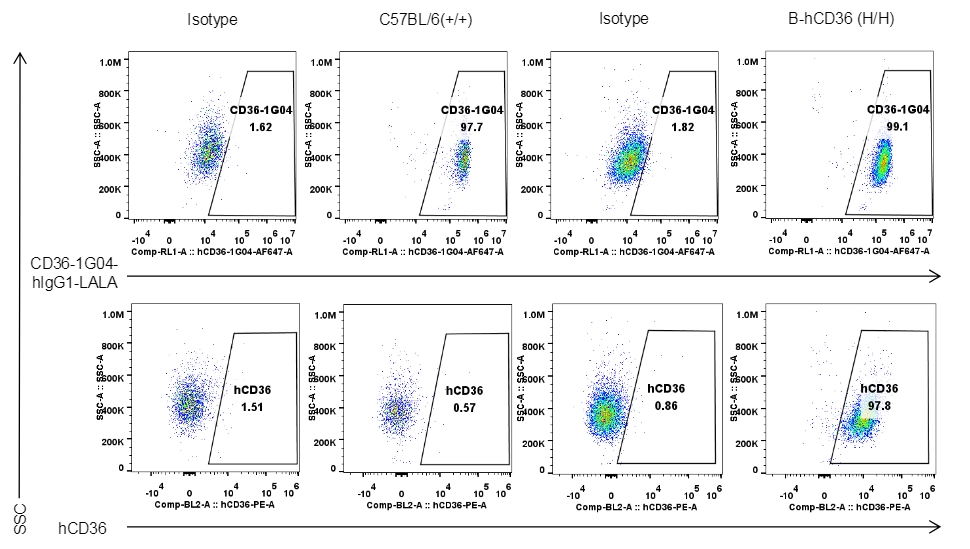
Antibody-binding assay to test B-hCD36 model using anti-CD36 antibody
Strain specific CD36 expression analysis in homozygous B-hCD36 mice by flow cytometry. Peritoneal exudative macrophages were collected from wild-type mice (+/+) and homozygous B-hCD36 mice (H/H), and analyzed by flow cytometry with anti-CD36 antibody. Human CD36 was exclusively detectable in homozygous B-hCD36 mice but not in wild-type mice. CD36-1G04-hIgG1-LALA antibody is cross-recognized in mice and human.
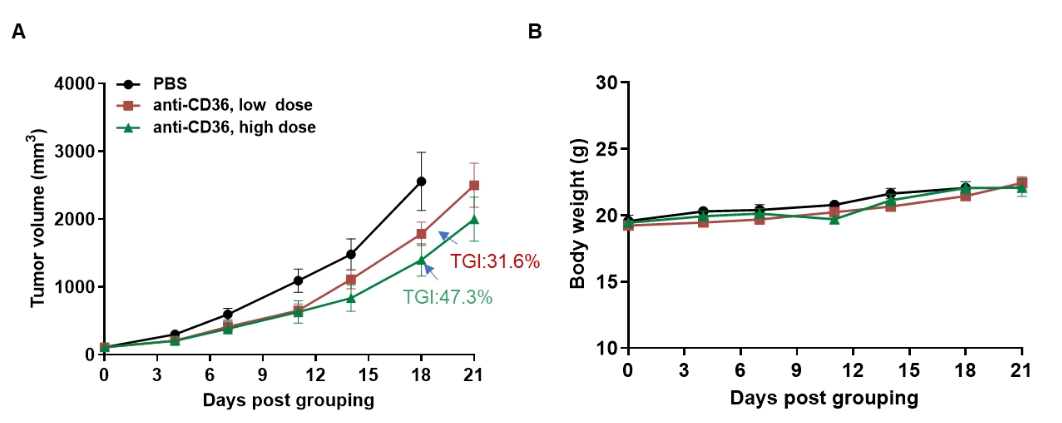
In vivo efficacy of anti-CD36 antibodies
Antitumor activity of anti-CD36 antibodies in B-hCD36 mice. (A) Anti-CD36 antibodies (in house) inhibited MC38 tumor growth in B-hCD36 mice. Murine colon cancer MC38 cells were subcutaneously implanted into homozygous B-hCD36 mice (female, 8-week-old, n=6). Mice were grouped when tumor volume reached approximately 100 mm3, at which time they were treated with anti-CD36 antibodies. (B) Body weight changes during treatment. As shown in panel A, anti-CD36 antibodies were efficacious in controlling tumor growth in B-hCD36 mice, demonstrating that the B-hCD36 mice provide a powerful preclinical model for in vivo evaluation of anti-CD36 antibodies. Values are expressed as mean ± SEM.
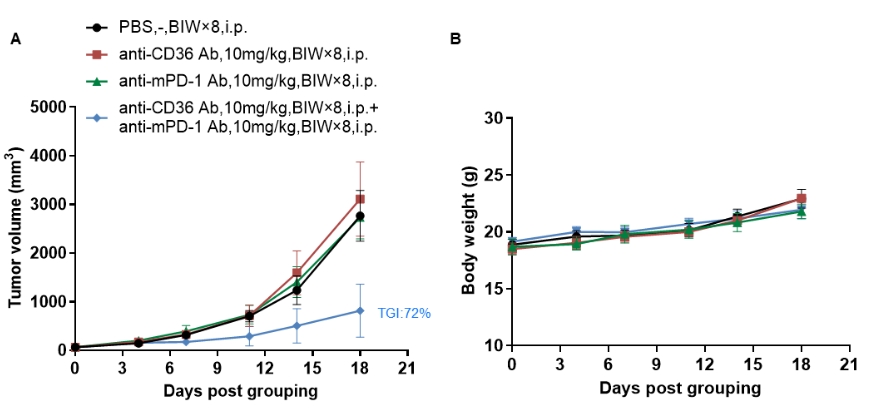
Combination therapy of anti-mouse PD-1 antibody and anti-human CD36 antibody
Anti-tumor activity of anti-mouse PD-1 antibody combined with anti-human CD36 antibody in B-hCD36 mice. (A) Anti-mPD-1 antibody combined with anti-hCD36 antibody inhibited MC38 tumor growth in B-hCD36 mice. Murine colon cancer MC38 cells were subcutaneously implanted into homozygous B-hCD36 mice (female, 7-week-old, n=5). Mice were grouped when tumor volume reached approximately 60 mm3, at which time they were treated with antibodies in panel A. (B) Body weight changes during treatment. As shown in panel A, antibodies combination were efficacious in controlling tumor growth in B-hCD36 mice, demonstrating that the B-hCD36 mice provide a powerful preclinical model for in vivo evaluation of anti-CD36 antibodies. The data was got from the collaborator, all antibodies used in the experiment belong to the client. Values are expressed as mean ± SEM.
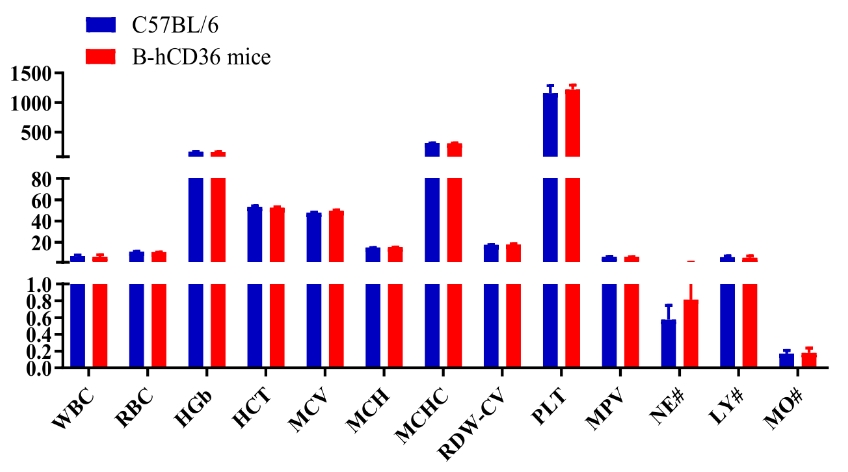
Blood routine test in B-hCD36 mice
Complete blood count (CBC). Blood from female C57BL/6 and B-hCD36 mice (n=8, 6-8 week-old) was collected and analyzed for CBC. The measurements of B-hCD36 mice were similar to that in C57BL/6 mice, indicating that humanization does not change blood cell composition and morphology. Values are expressed as mean ± SEM.
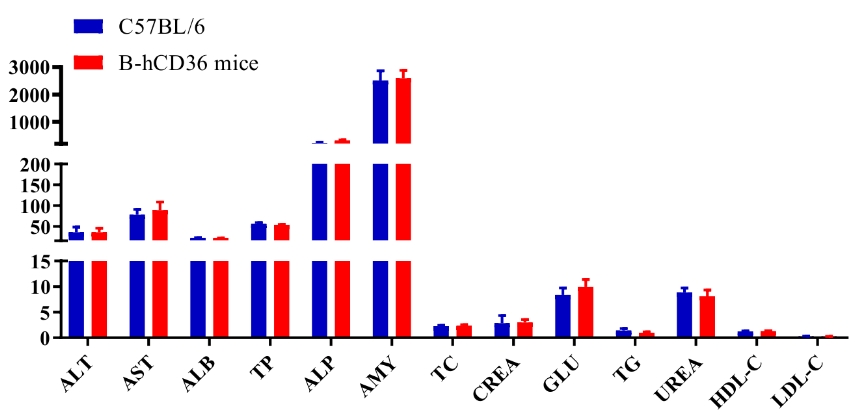
Blood chemistry of B-hCD36 mice
Blood chemistry tests of B-hCD36 mice. Serum from the C57BL/6 and B-hCD36 mice (n=8, 6-8 week-old) was collected and analyzed for levels of indicators. The measurements of B-hCD36 mice were similar to that in C57BL/6 mice, indicating that humanization does not change the health of related tissues, such as liver. Values are expressed as mean ± SEM.
* When publishing results obtained using this animal model, please acknowledge the source as follows: The animal model [B-hCD36 mice] (Cat# 111045) was purchased from Biocytogen.